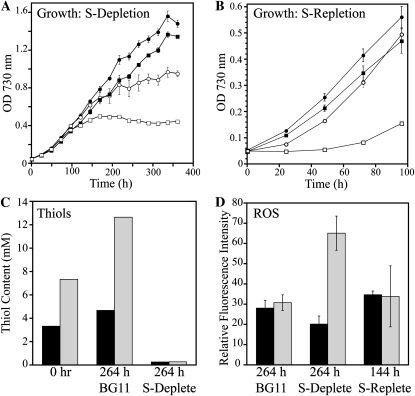
Figure 9.
Characterization of sulfate (S) depletion in ΔgshB::GmR cells. A, Growth of the wild type (circles) and ΔgshB::GmR (squares) in BG11 (black symbols) or BG11 containing 10% sulfate (30.3 μm; white symbols). Values represent means ± se (n = 3). B, Growth of the wild type (circles) and ΔgshB::GmR (squares) in BG11 after 264 h of growth in sulfate-deplete (white symbols) or BG11 (black symbols) medium. Values are means ± se of three cultures. C, The major cellular thiol in the wild type (GSH; black bars) and ΔgshB::GmR (γ-EC; gray bars) was quantified by HPLC prior to sulfate depletion (0 h) after 264 h of growth in BG11 or in sulfate-deplete medium. Each value represents a single measurement and is consistent with the results of at least three independent experiments. D, ROS accumulation after 264 h of growth in BG11 or sulfate-deplete medium and after 144 h of recovery in BG11 medium. Error bars represent se of three measurements each from three independent cultures.

