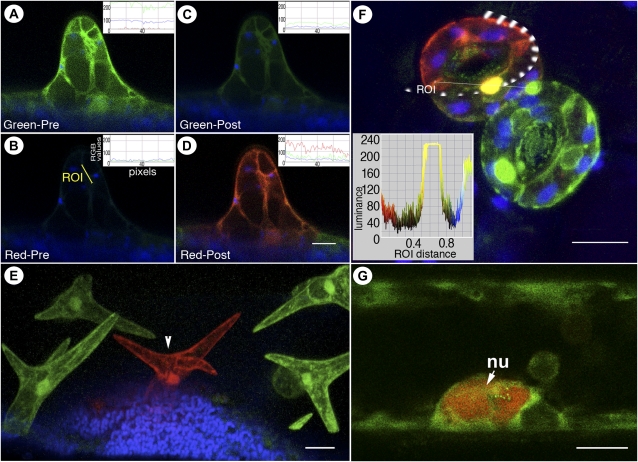
Figure 1.
Visualization of green and red forms of mEosFP distinct from chlorophyll fluorescence (false-colored blue) in transgenic Arabidopsis plants expressing mEosFP-cytosolic. A to D, Differential labeling of a single-celled trichome at an early developmental stage using nontargeted mEosFP-cytosolic expressed under the control of a trichome-specific GLABRA2 promoter. The inset RGB fluorescence intensity line traces in each panel depict the prephotoconversion and postphotoconversion values of red, green, and blue per pixel along the diagonal depicted in B. The RGB values are calculated on a standard eight-bit scale of 0 to 255 stretching across the region of interest (ROI). Note the residual green fluorescence of mEosFP in C. E, Mature trichomes on a transgenic Arabidopsis leaf visualized 48 h after mEosFP-cytosolic had been photoconverted in the central trichome cell (arrowhead) show the stability of the red form of mEosFP following its photoconversion. Note that simultaneous visualization of both green and red forms provides the comparative controls within a single scanned image. F, Two pairs of guard cells developing in an aberrant pattern on a transgenic mEosFP-cytosolic plant demonstrate the major colors that can be obtained following epifluorescent photoconversion followed by simultaneous visualization. The top guard cell (red) contains fully photoconverted mEosFP-cytosolic (region of illumination ringed by the broken line); a partially photoconverted nucleus appears yellow, while cytoplasmic aggregates in the lower pair of guard cells retain the unconverted G-mEosFP form. The inset depicts color luminance along the marked region of interest, which is helpful in quantifying and interpreting color overlap following photoconversion. G, A nucleus (nu) in a hypocotyl epidermal cell of a light-grown seedling exhibits the R-mEosFP form without an intentional photoconversion and suggests that the red form might accumulate within the nucleus. All images were taken using microscopy system 2. Bars = 25 μm (A–E), 10 μm (F), and 5 μm (G).

