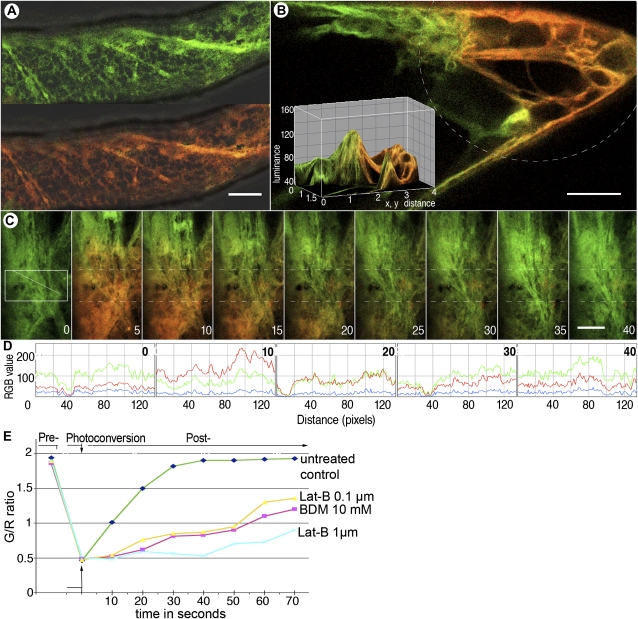
Figure 4.
CX::mEosFP demonstrates potential for estimating membrane flow through the analysis of initial color recovery after photoconversion using microscopy system 2. A, A cell from a transgenic Arabidopsis seedling expressing CX::mEosFP shows unconverted (green, top portion) and photoconverted (red, bottom portion) labeling of cortical ER membranes. B, Locally photoconverted CX::mEosFP (broken line) in a cell reveals a quantifiable color gradient (depicted in the inset) due to the rapid mobility and intermixing of red- and green-highlighted ER membranes. This observation formed the basis for the color tracking shown in C to E. C, Time-lapse sequence over 40 s shows the initial (nonconverted) green state of CX::mEosFP (panel 1 at 0 s). Photoconversion carried out using a circular beam from a violet-blue D filter for 5 s made a subcellular region fluoresce red (panel 2 at 5 s). Subsequent recovery of the green color in the delineated region of interest lying along the diagonal line within the photoconverted area (box in panel 1 and hatched line in subsequent time panels) is shown taking place over the next seven steps. Bars = 10 μm. D, Line traces of diagonals in successive panels from C subjected to color quantification using a standard 0 to 255 RGB scale depict the change in green and red levels and the nearly complete recovery of green fluorescence over time (e.g. time point 0 compared with 40 s). E, A comparison of CX::mEosFP movement over 70 s in untreated control cells and cells treated with 0.1 or 1.0 μm latrunculin B (Lat-B) and 10 mm BDM following a photoconversion step of 5 s. Green/red (G/R) ratios (averaged from three separate experiments) plotted against time demonstrate that the relative green fluorescence recovery time varies with cellular conditions. Therefore, this method can be applied to analyze and compare protein and membrane mobility in cells.

