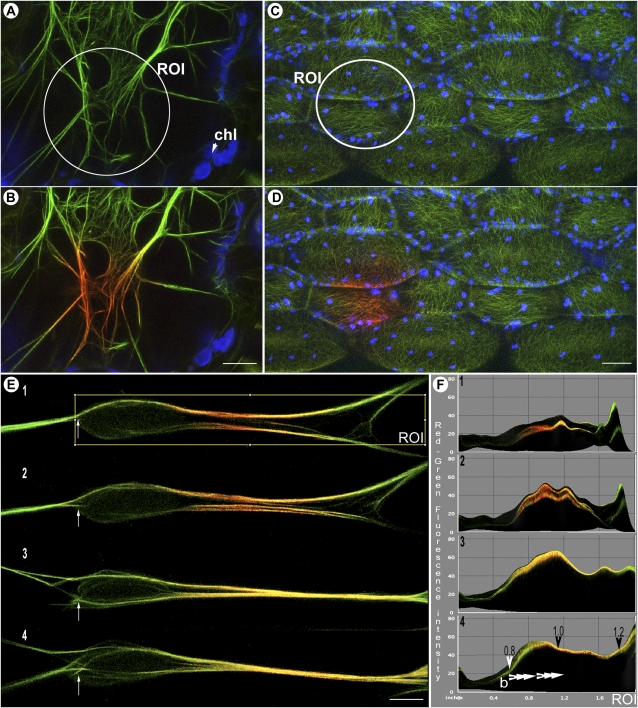
Figure 5.
mEosFP-based probes for cytoskeletal elements. A and B, LIFEACT::mEosFP represents the smallest live imaging probe for F-actin. Actin filaments in transgenic Arabidopsis plants are efficiently highlighted in green (region of interest [ROI] in A) before and in red (B) after photoconversion. Chloroplasts (chl; false-colored blue) are covisualized with both forms of mEosFP. C and D, Transgenic Arabidopsis plants expressing mEosFP::MBD-MAP4 highlight cortical microtubules (C), which have been photoconverted locally (D) in a specific region of interest (shown in C). Covisualized chloroplasts are depicted in blue. E, Tracking changes in cytoskeletal elements is possible using mEosFP labeling. Shown in E1 to E4 are images taken 10 s apart to show a change in F-actin organization as filaments (E1) bundle together (E4). The directional dispersal of the photoactivated red form of mEosFP is apparent between the four images and provides a means of assessing F-actin polarity in living cells. An independent positional marker on the sequential images (e.g. arrows in E1–E4) may minimize interpretational errors arising from a cytoplasmic streaming-induced drift in the actin cable. F, A post-image-acquisition three-dimensional surface plot (ImageJ) of the region of interest depicted in E1 (and subsequent images) provides quantification of red and green fluorescence values existing in an image on a standard RGB scale (values between 0 and 255). Using these values, a red-green ratio of 1 in the acquired image suggests equal green and red molecules, while ratios higher than 1 suggest increased red levels. F1 to F4 depict the shift in red fluorescent molecules toward the right side of the time-lapse images. Alterations in the red-green ratio (arrowheads in F4) suggest that new, unphotoconverted monomers are being added from one end (left side of images) and therefore cause the photoconverted F-actin region to shift toward the right. As indicated by the arrowheads (F4), the net fast-growing, barbed ends of the actin filaments lie on the left. All images were acquired using microscope system 2. Bars = 5 μm (A, B, and E) and 20 μm (C and D).

