Figure 8.
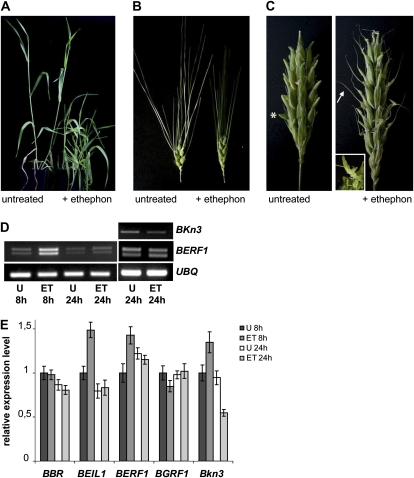
Ethephon-induced alterations in barley. A, Left, untreated Kap plants carrying the main culm at the booting stage. Right, ethephon-treated Kap plants displaying three to four tillers each. B, Left, untreated wild-type spike. Right, ethephon-treated wild-type spike. C, Left, untreated Kap spike carrying the typical ectopic structures (developing hoods, indicated by an asterisk). Right, ethephon-treated Kap spike displaying rudimental awns (indicated by an arrow). The inset shows an abnormal ovary in closeup. D, Left, RT-PCR results of RNA extracted from Kap developing leaves 8 and 24 h after ethephon treatment. Right, RT-PCR results of RNA extracted from Kap immature inflorescences. Ubiquitin (UBQ) was used as an amplification control in PCR. E, Relative expression levels of Bkn3 and KIBP genes in immature inflorescences of the Kap mutant 8 and 24 h after ethephon treatment. The ratio between each gene level and the Ubiquitin gene from untreated plants was arbitrarily set at 1. Three biological replicates were performed independently, and mean values with sd are indicated. U, Untreated; ET, ethephon treated. [See online article for color version of this figure.]

