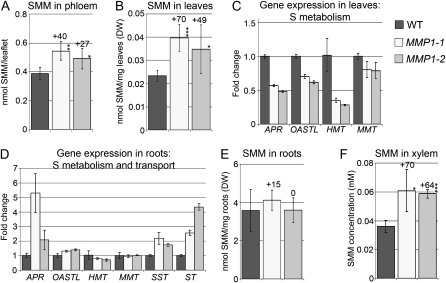
Figure 2.
SMM levels and expression of genes involved in S metabolism and transport in MMP1 plants. A, SMM concentrations in phloem exudates of MMP1 and wild-type (WT) plants (n = 4). B, SMM levels in leaves (n = 4). DW, Dry weight. C and D, Fold change in gene expression of APR, OASTL, HMT, MMT, and sulfate transporters SST and ST in leaves (C) and roots (D). For OASTL, MMT, HMT, SST, and ST expression analyses, degenerated primers were used, since pea homologs are unknown. E, SMM levels in roots (n = 4). F, SMM concentrations in xylem sap (n = 3). Results are presented as means ± sd. Asterisks indicate significant differences from the wild type detected by Student’s t test: * P < 0.05, ** P < 0.01, *** P < 0.001.

