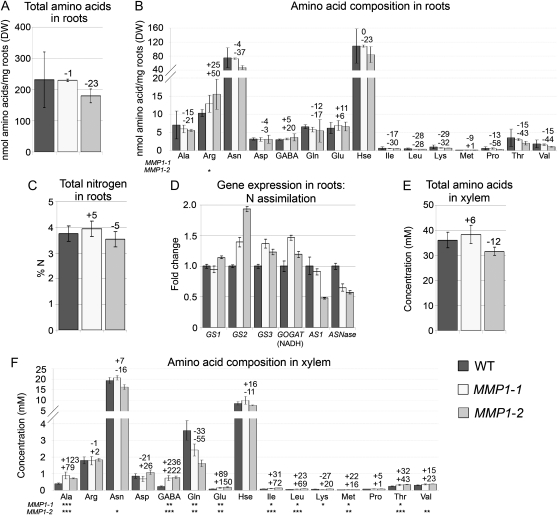
Figure 4.
Analysis of N levels in root and xylem of MMP1 plants, and root gene expression studies. A, Total free amino acid levels in roots of MMP1 compared with wild-type (WT) plants (n = 4). DW, Dry weight. B, Amino acid composition and concentration in roots (n = 4). Hse, Homo-Ser. C, Total N levels in roots (n = 4). D, Fold change in gene expression of pea GS1, GS2, and GS3, and AS1. Degenerated primers were used for NADH-dependent Glu synthase [GOGAT (NADH)] and ASNase. E, Total free amino acid levels in xylem sap (n = 3). F, Amino acid composition and concentration in xylem sap (n = 3). Results are presented as means ± sd. Asterisks indicate significant differences from the wild type detected by Student’s t test: * P < 0.05, ** P < 0.01, *** P < 0.001.

