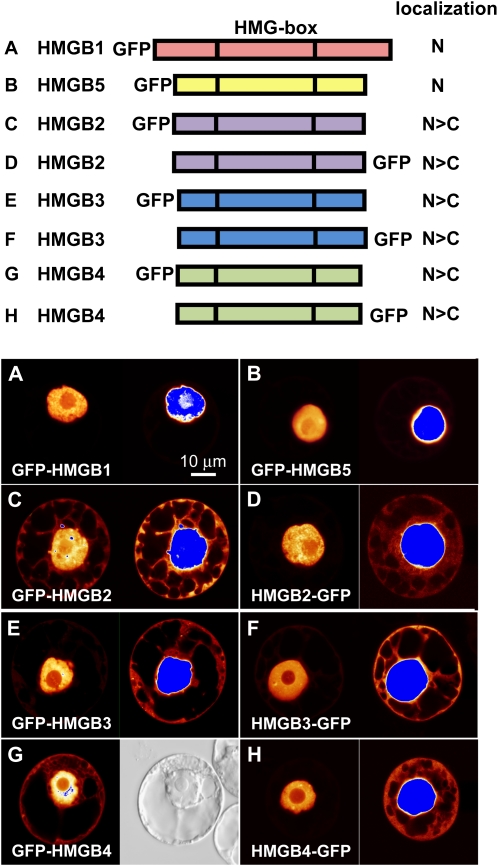
Figure 2.
Detection of HMGB1 and HMGB5 in the nucleus, while HMGB2/3 and HMGB4 are observed in both the nucleus and the cytoplasm. Protoplasts prepared from BY-2 tobacco cell suspension cultures were transformed with plasmids driving the expression of the indicated GFP fusion proteins (for overview, see top panel). The observed nucleocytoplasmic distribution is also summarized in the top panel (N, nuclear accumulation; N>C, indicating the tendency of higher fluorescence in the nucleus relative to the cytoplasm) based on inspecting 60 to 80 transformed protoplasts each. A, GFP-HMGB1. B, GFP-HMGB5. C, GFP-HMGB2. D, HMGB2-GFP. E, GFP-HMGB3. F, HMGB3-GFP. G, GFP-HMGB4. H, HMGB4-GFP. The left part of each panel represents an image of a protoplast at normal exposure, while the right part shows an overexposed image of the same protoplast (except in G, where instead of the overexposed image, the corresponding bright-field image is shown). Fluorescence intensities in CLSM images of transformed protoplasts are displayed using a false-color palette. Low-fluorescence signals are indicated by red color, and progressively stronger signals are indicated by orange over yellow to white. Blue indicates top-scale signals/overexposure. Bar = 10 μm.

