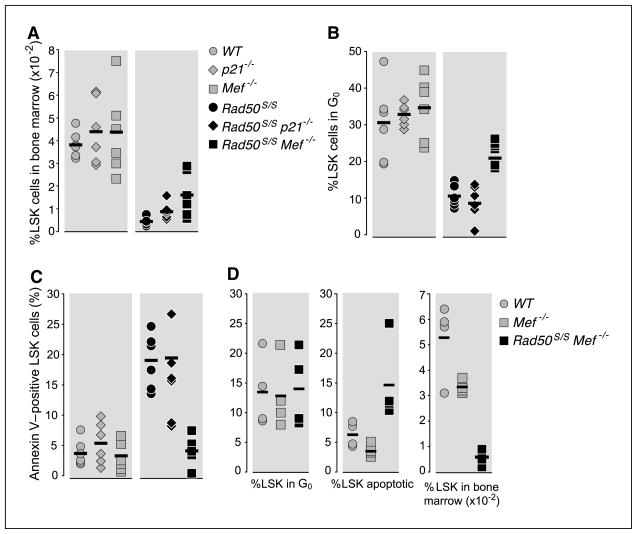
Figure 4.
Maintenance of LSK quiescence abrogates LSK apoptosis in Rad50S/S mice. A, the percentage of Lin− Sca-1+ c-kit+ (LSK) cells from 2-week-old WT, Mef−/−, p21−/−, Rad50S/S, Rad50S/SMef−/−, and Rad50S/S p21−/− mice is plotted (n = 6). P = 0.02, Rad50S/S versus Rad50S/S p21−/−; P = 0.01, Rad50S/S versus Rad50S/S Mef−/−. B, percentage of Ki-67 and Hoechst double-negative LSK cells from the mice depicted in A. Symbols as in A. P = 0.631, Rad50S/S versus Rad50S/S p21−/−; P = 0.037, Rad50S/S and Rad50S/S Mef−/−. C, percentage of Annexin V–positive LSK cells from the mice depicted in A. Symbols as in A. P = 0.423, Rad50S/S versus Rad50S/S p21−/−; P = 0.004, Rad50S/S versus Rad50S/S Mef−/−. D, WT, Mef−/−, Rad50S/S, and Rad50S/S Mef−/− LSK were pushed into cycle with 2-d sequential injections of 250 μg/kg G-CSF. On day 3, the percentage of LSK cells in bone marrow was measured (n = 4; left). Middle and right, the percentages of Annexin V–positive or Ki-67 and Hoechst double-negative LSK cells are plotted, respectively.

