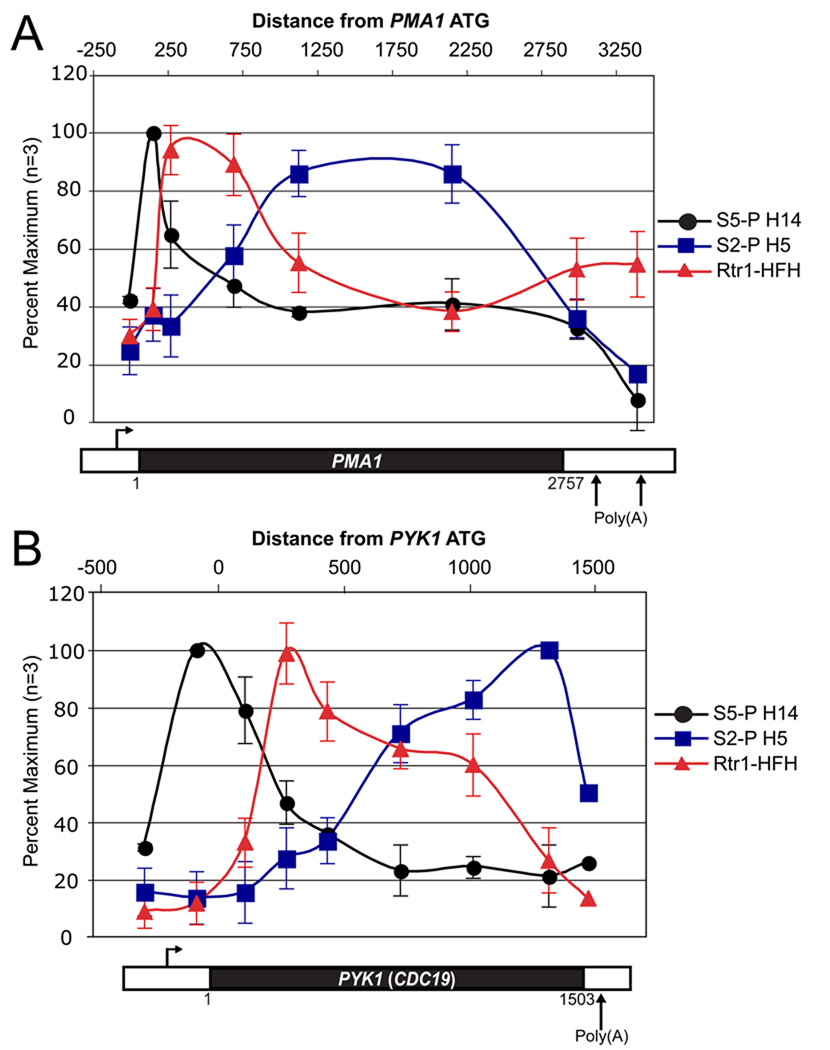
Figure 3.
Rtr1 localizes to open reading frames. A. ChIP assays were performed using antibodies directed against different forms of RNAPII and Rtr1 as indicated. Quantitation of the S5-P (black circles) and S2-P (blue squares) occupancy compared to the occupancy of Rtr1 (red triangles) across the PMA1 genomic loci. B. Quantitation of protein occupancy across the PYK1 genomic loci as performed above. These data are shown as the average percent maximum IP ± standard deviation for comparison purposes between the different antibodies (n=3). The midpoint of the PCR amplicon was used as the distance from the ATG. A schematic representation of the genomic loci for each gene is shown below the graphs to illustrate the approximate location of the promoter and polyadenylation regions.

