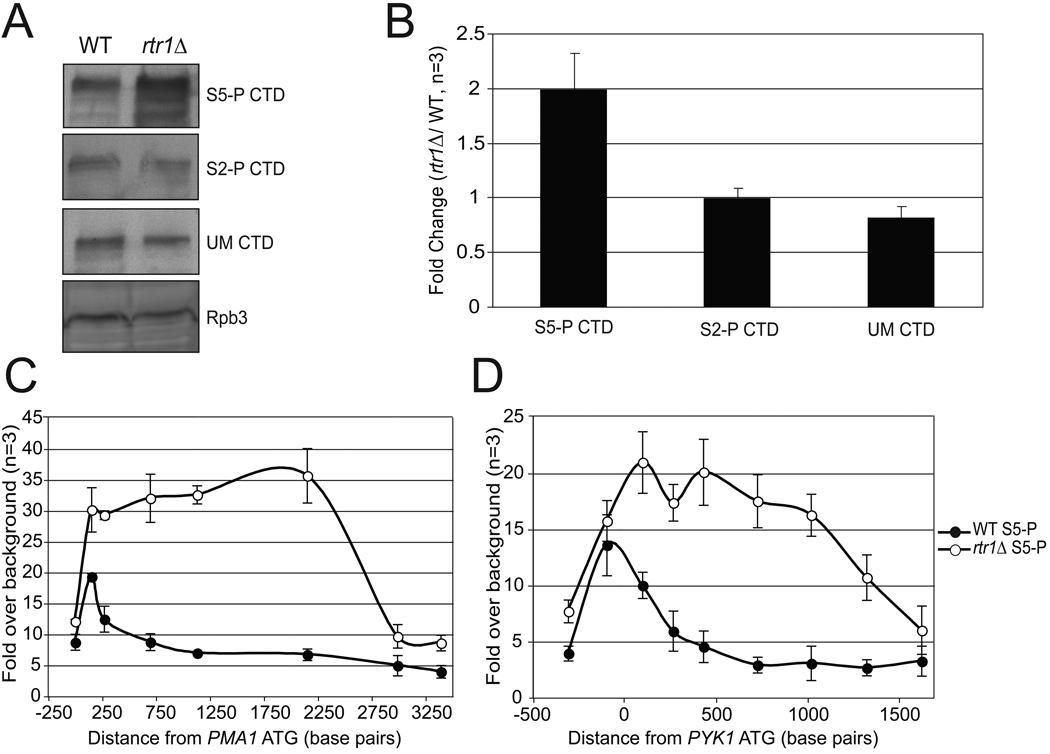
Figure 4.
Rtr1 deletion causes increased RNAPII CTD S5-P in vivo. A. Western blot analysis of whole cell extracts of wild type (WT) compared to rtr1Δ. B. Quantitation of western blots represented in A. The data are shown as average fold enrichment over wild type ± standard deviations (n=3). Quantitation of the fold enrichment of S5-P RNAPII occupancy across the PMA1 (C) and PYK1 (D) open reading frames using the H14 monoclonal antibody. The midpoint of the PCR amplicon was used as the distance from the PMA1/PYK1 ATG. Data is expressed as average fold enrichment ± standard deviation (n=3), which was calculated by dividing the percent IP of each region over the percent IP of a control region on chromosome 5 where RNAPII does not bind.

