
Figure 7.
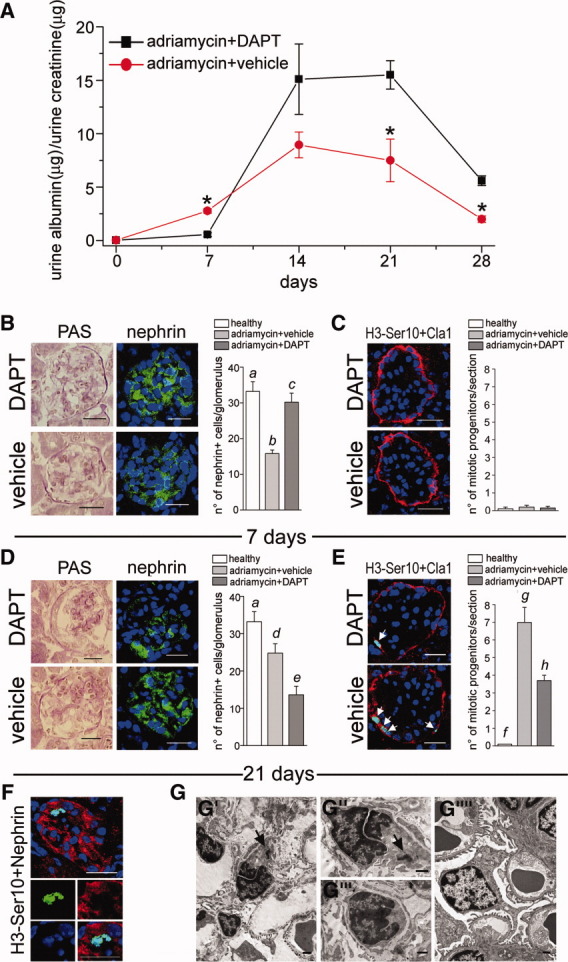
Notch inhibition differentially regulates the balance between podocyte injury and regeneration in mice with focal segmental glomerulosclerosis. (A): Time course assessment of albumin/creatinine ratio as measured in mice with adriamycin nephropathy undergoing daily treatment with vehicle (red circle) or with DAPT (black square). Data are mean ± SEM as obtained in three independent experiments (n = 15 mice at each time point for each group of treatment); *, p < .05. (B): Left: PAS staining of renal sections of mice with adriamycin-induced nephropathy treated with vehicle or with DAPT. Scale bar = 20 μm. Middle: Nephrin staining (green) shows significant podocyte depletion in vehicle treated in comparison with DAPT-treated mice. Topro-3 (blue) counterstains nuclei. Scale bar = 20 μm. Right: Quantitation of number of podocytes (nephrin+ cells)/glomerulus is shown. Data are mean ± SEM as obtained in three independent experiments. a versus b, a versus c, and b versus c; p < .001. (C): Left: Double label immunofluorescence for the mitosis marker H3-Ser10 (green) and the mouse renal progenitor marker Cla1 (red) shows the absence of mitotic renal progenitors after 7 days of injury. Topro-3 (blue) counterstains nuclei. Scale bar = 20 μm. Right: Quantitation of number of mitotic progenitors (H3-Ser10+Cla1+ cells)/section is shown. Data are mean ± SEM as obtained in three independent experiments. (D): Left: PAS staining of renal sections of mice with adriamycin-induced nephropathy treated with vehicle or with DAPT. Scale bar = 20 μm. Middle: Nephrin staining (green) shows podocyte depletion in DAPT-treated in comparison with vehicle-treated mice. Topro-3 (blue) counterstains nuclei. Scale bar = 20 μm. Right: Quantitation of number of podocytes (nephrin+ cells)/glomerulus is shown. Data are mean ± SEM as obtained in three independent experiments. a versus d, a versus e, b versus d, and c versus e; p < .001. (E): Left: Double label immunofluorescence for H3-Ser10 (green) and Cla1 (red) shows significantly higher numbers of mitotic renal progenitors after 21 days of injury in vehicle treated in comparison with DAPT-treated mice. Topro-3 (blue) counterstains nuclei. Scale bar = 20 μm. Right: Quantitation of number of mitotic progenitors (H3-Ser10+Cla1+ cells)/section is shown. Data are mean ± SEM as obtained in three independent experiments. f versus g, f versus h, and g versus h; p < .001. (F): H3-Ser10 (green) and nephrin (red) shows the occurrence of mitotic podocytes with abnormal nuclear morphology. Topro-3 (blue) counterstains nuclei. Scale bar = 20 μm. A representative image is shown. (G): Electron microscopy reveals aberrant mitoses. (G′): Electron micrographs of glomerular podocytes from a mouse with adriamycin nephropathy showing abnormal nuclei and a micronucleus (arrow) consistent with mitotic catastrophe. (G″): High-power magnification of (G′) better depicting the micronucleus (arrow). (G″′): High-power magnification of a heterochromatic nucleus with peculiar symmetrical chromatin pattern, reminiscent of aberrant mitosis. (G″″): A normal podocyte is shown for comparison. Scale bar = 1 μm. Representative images are shown. Abbreviations: DAPT, N-[N-(3,5-difluorophenacetyl)-L-alanyl]-S-phenylglycine t-butyl ester; PAS, periodic acid schiff.