Figure 1.
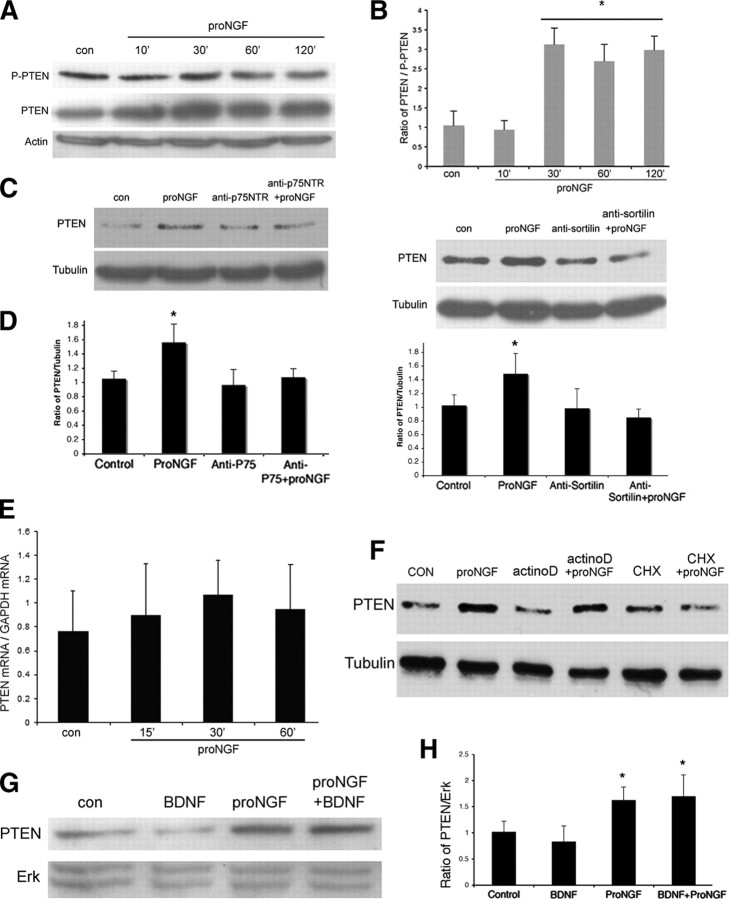
ProNGF increases PTEN in BF neurons. A, E16 BF neurons were cultured for 5 d and treated with proNGF (1 ng/ml) at different time points, as indicated. Cells were lysed for Western blot analysis and probed for p-PTEN and PTEN. Blots were stripped and reprobed for actin. The blot shown is representative of five independent experiments. B, Quantification of PTEN relative to p-PTEN. Data are from five independent experiments and shown as mean band density ± SE. The asterisk indicates values different from control by ANOVA with Bonferroni post hoc analysis (p < 0.05). C, Induction of PTEN by proNGF requires both p75 and sortilin receptors. BF neurons were pretreated with anti-sortilin or anti-p75NTR antibodies for 30 min and then treated with proNGF (10 ng/ml, 30 min) alone or with the antibodies. The level of PTEN protein was measured by Western blot analysis. The blots were stripped and reprobed for tubulin. The blots shown are representative of three independent experiments. D, Quantification of three independent experiments exemplified in C and represented as mean band density ± SE. Asterisks indicates values different from control by ANOVA with Bonferroni post hoc analysis (p < 0.05). E, ProNGF does not regulate PTEN mRNA in BF neurons. BF neurons were treated with proNGF for the indicated times. Total RNA was extracted, and qPCR was performed to detect the level of PTEN mRNA relative to GAPDH mRNA. Data are from three independent experiments. F, New protein synthesis, but not mRNA synthesis, is required for PTEN induction. Cultured BF neurons were treated with proNGF (1 ng/ml, 30 min), cycloheximide (CHX; 1 μg/ml, 60 min), actinomycin-D (actinoD; 1.5 μm, 60 min), or both. Western blot analysis was performed to detect the level of PTEN. Blots were then stripped and reprobed for tubulin. The blot is representative of three independent experiments. G, ProNGF increases PTEN in the presence of BDNF. Cultured BF neurons were treated with BDNF (10 ng/ml), proNGF(1 ng/ml), or both for 30 min. Western blot was performed to probe for PTEN and stripped and reprobed for Erk to demonstrate equal protein loading. The blot is representative of three independent experiments. H, Quantification of PTEN relative to Erk from three independent experiments. Bars represent mean band density ± SE. The asterisk indicates values different from control by ANOVA with Bonferroni post hoc analysis, p < 0.05. con, Control.

