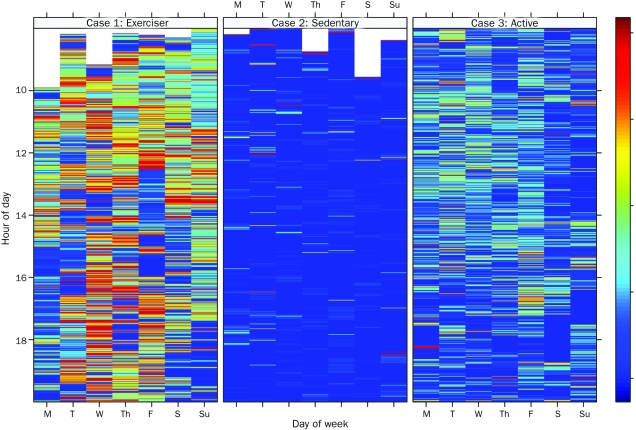
FIGURE 2.
Daily activity patterns. Three different activity patterns are illustrated using cluster heat maps derived from accelerometer data (counts/min): the “exerciser” profile, the “sedentary” profile, and the “active” profile.
Data from the National Health and Nutrition Examination Survey.12

