
Figure 4.
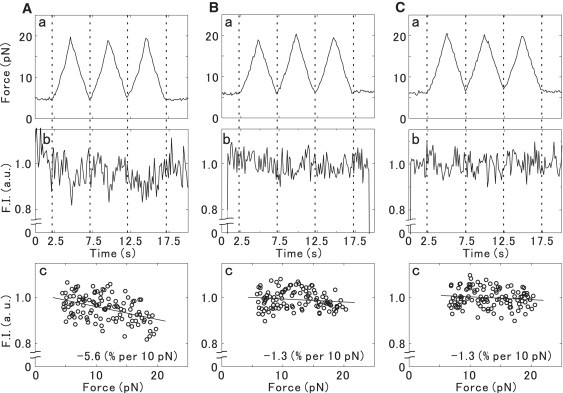
Effect of the external force, imposed in a triangular waveform, on the fluorescence intensity of single actin filaments. Actin filaments were labeled with (A) TMR, (B) BODIPY, or (C) RP. (a) The applied force was changed between ∼5 pN and ∼20 pN, and the cycle was repeated three times during each measurement. (b) During the same time intervals, the total fluorescence intensity of each filament within the rectangular region (see Fig. 2) was measured in arbitrary units averaged over 4/30 s, or four frames. (c) The values of fluorescence intensity obtained for the same actin filament as in a and b are plotted. Straight lines indicate the fluorescence intensity versus the force relationship obtained by linear regression analysis, and its slope is shown in the bottom-right corner. In both b and c, the effect of photobleaching on the fluorescence intensity is taken into account (for details, see text).