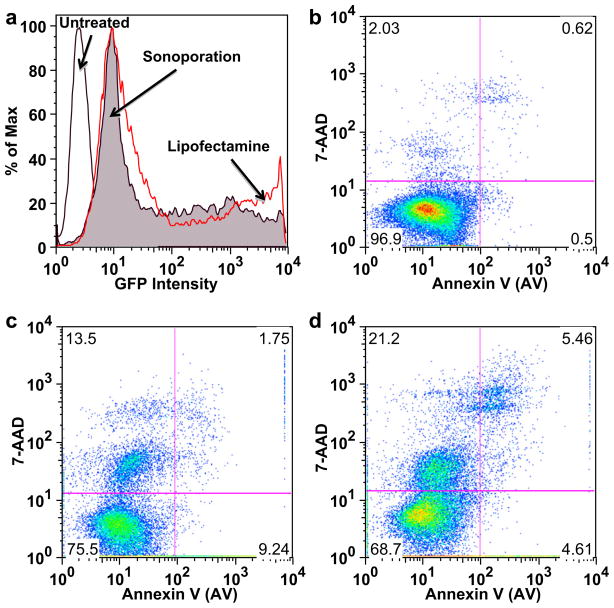
Fig. 3.
Flow cytometric analysis of HEK-293 viability and GFP expression. (a) Characteristic GFP intensity histogram on viable HEK-293 cells showing (1) minimal background fluorescence for untreated cells (unfilled black curve); (2) GFP expression in cells treated by Lipofectamine (open red curve); and (3) sonoporation with MBs (filled curve). Characteristic viability plots: (b) untreated healthy stained cells, (c) Cells transfected with pMax-GFP by Lipofectamine-2000 or (d) by sonoporation with MBs (2.0 W/cm2, duty cycle of 25%, 4 × 10⁷ neutral MBs per mL and 3.2 μg/mL of pMax-GFP plasmid).

