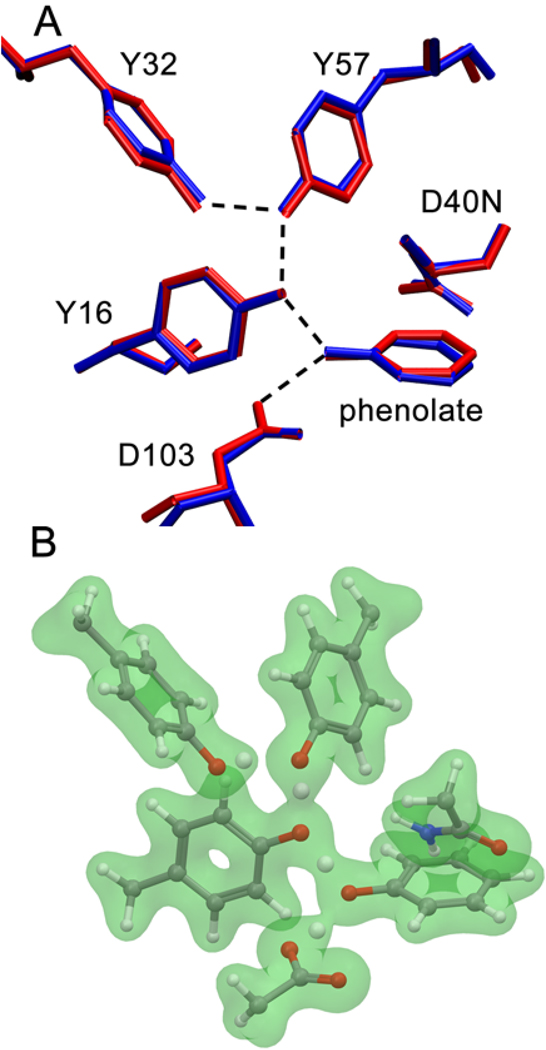
Figure 2.
(A) Comparison of the X-ray crystal structure (PDB: 2PZV) (blue) and the QM/MM optimized geometry (red) for phenolate bound to pKSI D40N. The hydrogen-bonding interactions are indicated by dashed lines. The RMSD between these structures for the active site residues and the phenolate is 0.26 Å. (B) Depiction of the calculated electron density (green) with an isovalue of 0.05 electrons per cubic Bohr for QM residues and phenolate in the active site. In these QM/MM calculations, the QM region included Tyr16, Asp103, Asp40Asn, Tyr32, Tyr57, and the phenolate.

