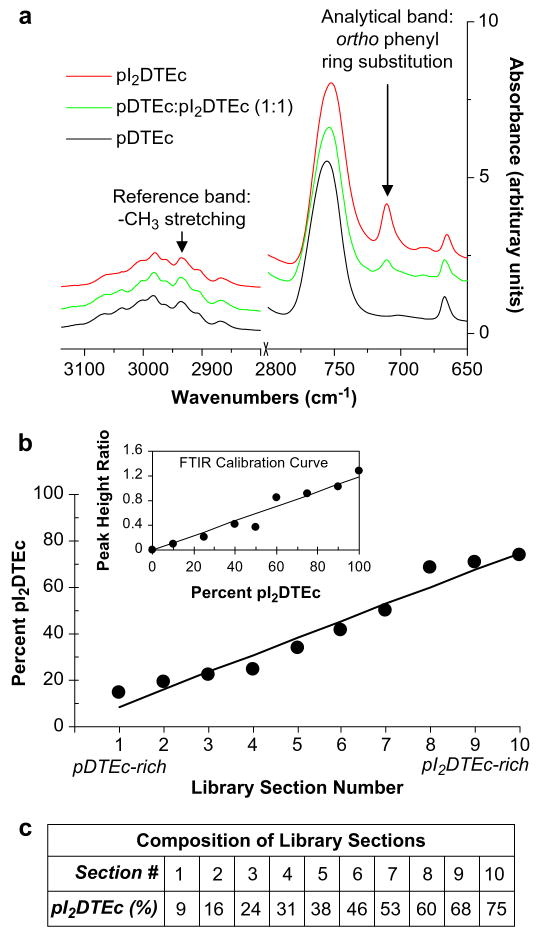
Fig. 2.
(a) Control FTIR spectra of pDTEc, pI2DTEc and pDTEc: pI2DTEc (1:1). Reference band was 2935 cm−1 while 710 cm−1 was the analytical band. (b) The composition of sections from a pDTEc/pI2DTEc scaffold library was determined from peak height ratios (710 cm−1/2935 cm−1) using a calibration curve (inset). Lines were fit by linear regression and the Pearson correlation coefficients for the calibration curve (inset) and scaffold libraries (main plot) were 0.97 (P < 0.0001) and 0.98 (P < 0.0001), respectively. (c) The composition for each library section was calculated from the linear fit to data plotted in Panel (b).

