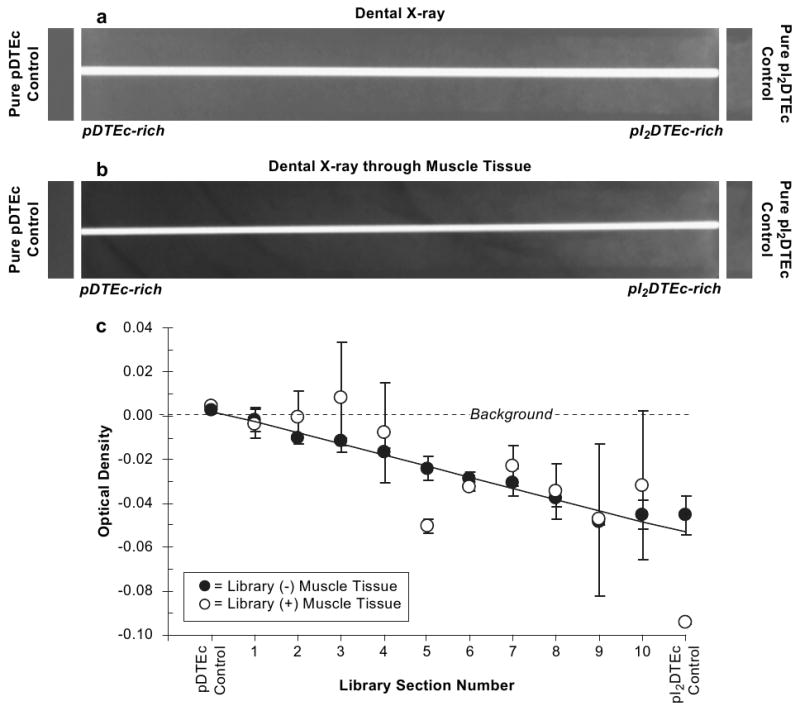
Fig. 5.

(a) Dental X-ray radiographs of a gradient scaffold library plus controls are shown. The white line down the middle of the radiograph is from the steel wire. (b) Scaffold libraries were covered by tissue (beef round steak, 0.75 cm thickness) and imaged by dental radiography to simulate imaging after implantation (center). (c) Optical density (OD) was determined by densitometry for 10 sections (7.5 mm) along the library radiographs. Both libraries were averaged and error bars are standard deviation of the mean (n = 2). Without and with muscle tissue are closed and open circles, respectively. OD values for control scaffolds are shown on ends of the plot. Linear regression lines had the Pearson correlation coefficients of 0.99 (P < 0.0001) and 0.74 (P < 0.01) without (solid line) and with muscle tissue (dashed line), respectively.
