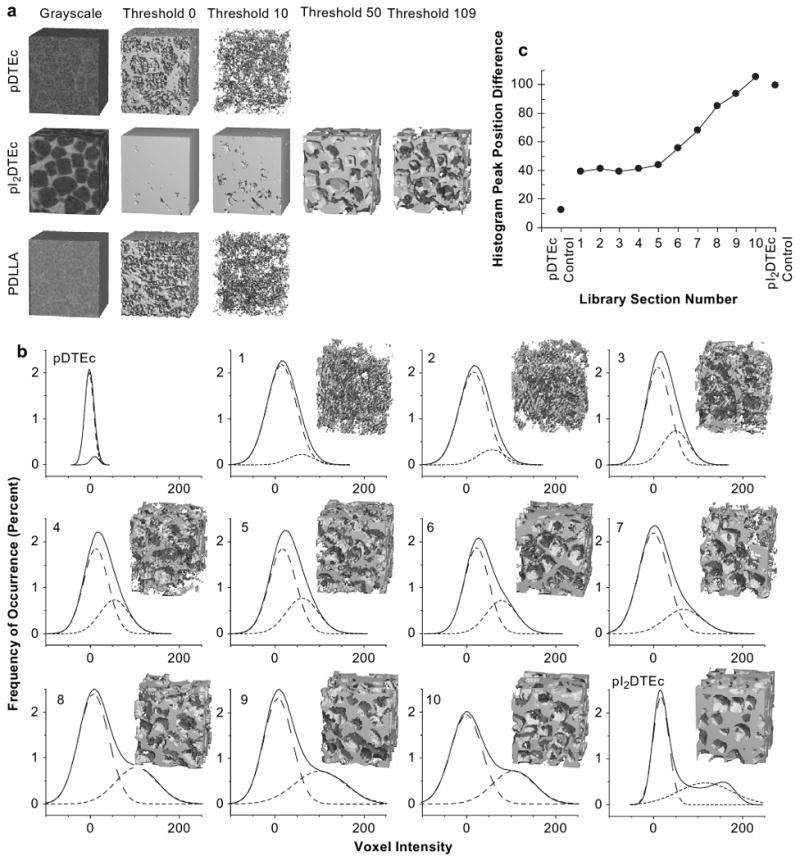
Fig. 6.

(a) Control scaffolds were imaged by μCT and 3D reconstructions (1.3 × 1.3 × 1.5 mm) at indicated thresholds are shown. For thresholds 50 or 109, segmentation images could not be constructed for pDTEc or PDLLA because voxel intensities were too low. (b) Histograms of “voxel intensity” (grey level) versus “frequency of occurrence” for 10 sections from a scaffold library plus controls using a volume of 2.5 mm (5,277,888 voxels) are shown (solid line). Nonlinear least squares fitting of two Gaussian peaks are represented by the two dashed line peaks under each histogram. All Gaussian fits had the Pearson correlation coefficients greater than 0.99. Insets are 3D reconstructions using threshold 50. (c) The difference between the center positions of the two Gaussian peak fits in Panel (b) was plotted against library section. Line is to aid the reader's eye.
