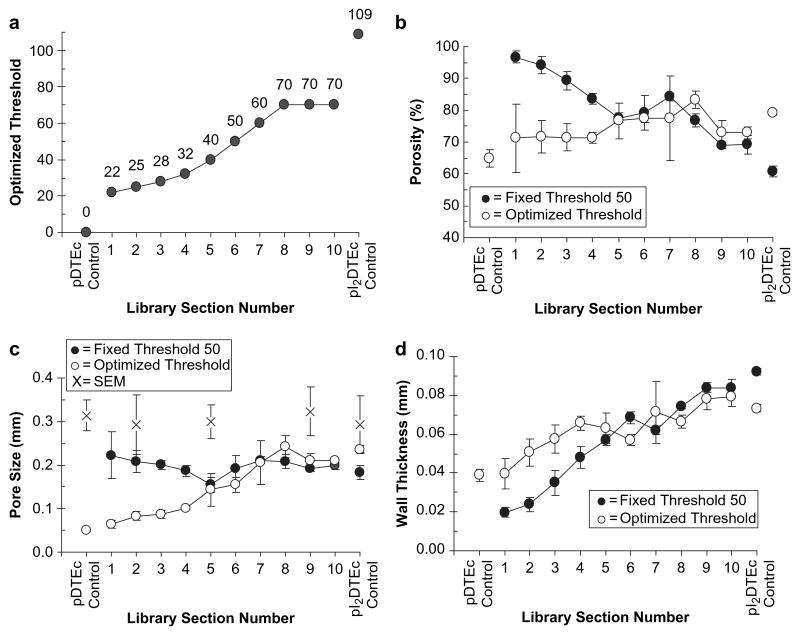
Fig. 7.
(a) Optimized thresholds for pDTEc/pI2DTEc library μCT images (plus controls) are plotted (values given above each point). A thresholding algorithm [30] identified an optimal threshold for control pI2DTEc but not for the libraries or control pDTEc. Visual acuity (operator-selected) was used to determine optimized threshold for libraries and control pDTEc [24,31]. (b–d) Scaffold library μCT images were analyzed using a constant threshold of 50 (solid circles) or the optimized thresholds (open circles) as given in Panel (a). Porosity, pore size and wall thickness are given in (b), (c) and (d), respectively. Five cubes of 2.5 mm3 volume (5,277,888 voxels) were analyzed for each section and averaged. Error bars are standard deviation (n = 5). Control pDTEc values at threshold 50 are not shown because a segmentation image could not be obtained. Pore size calculated from ImageJ analysis of electron micrographs is shown in (c) (“X” symbols, n = 6 pores, error bars are S.D.). Lines are to aid the reader's eye. Similar results were obtained for both libraries.

