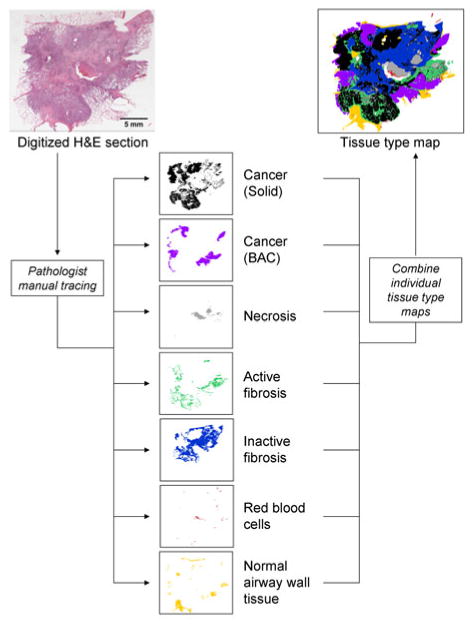
FIGURE 1.

A pathologist with a pulmonary sub-specialty manually traced the digitized H&E histological sections, resulting in a set of individual tissue type maps (binary images), which can be combined into a single representative image. The tissue type classes identified by the pathologist included cancerous tumor (in both: solid and bronchoalveolar presentations), necrosis, active and inactive fibrotic tissue, red blood cells, and normal tissue. This image segmentation required approximately two and a half hours to complete (original image magnification of 20×).
