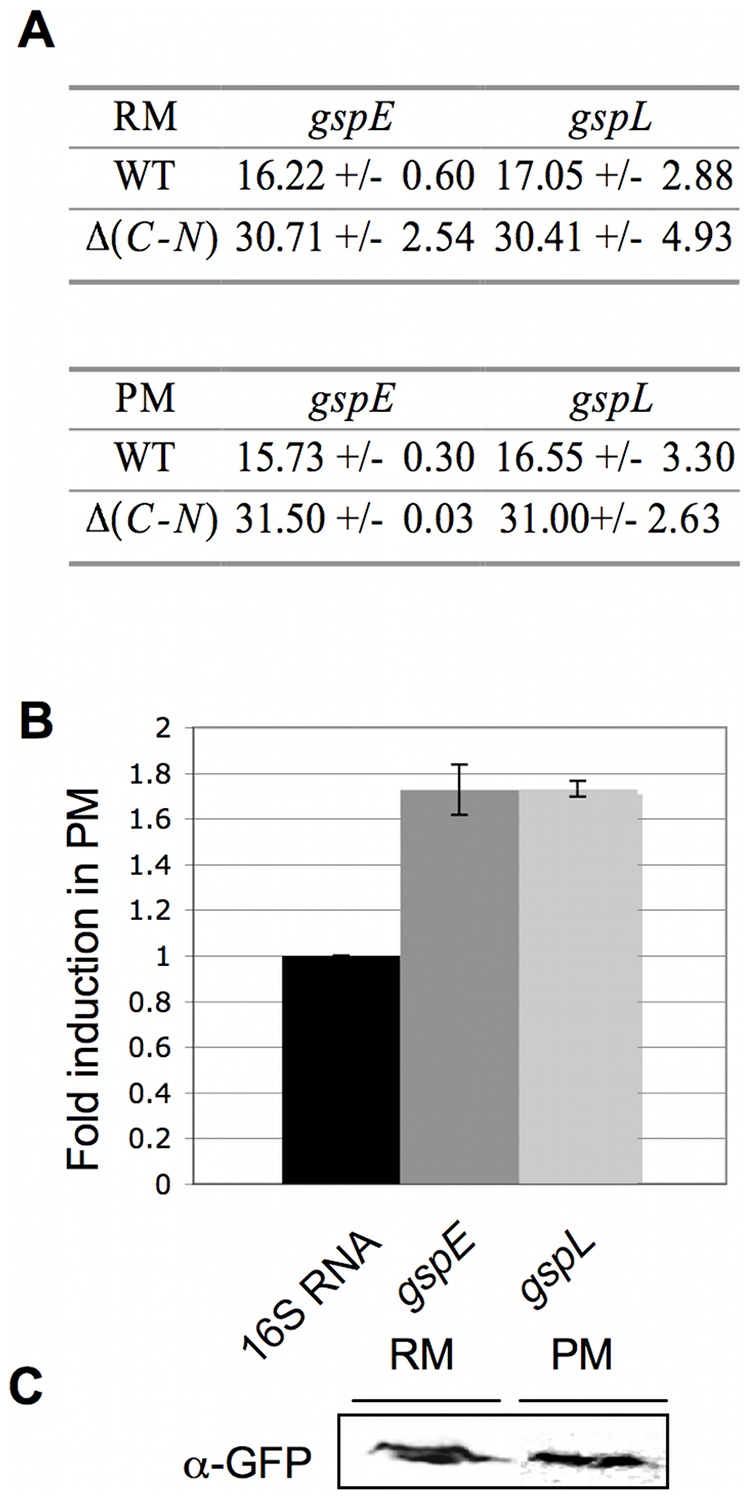
Figure 2. Expression of gspL and gspE in rich (RM) and poor (PM) media.

(A) Cycle Threshold (CT) averages for gspE and gspL (see Methods). CT averages were determined by qRT-PCR performed on mRNA extract from CB15N (WT) and CB15N Δ(gspC-gspN) (Δ(C-N)) grown in poor (PM) and rich (RM) media. (B) Fold induction in PM (on the Y-axis) for gspE and gspL. For each target gene, the relative quantity of mRNA was calculated as the ratio of CT averages obtained in PM compared to RM. Each relative quantity was normalized by the 16S RNA induction in the two media. (C) Production of mGFP-GspL in PM and RM. Immunoblots were done on cellular fractions from CB15N gspL::mgfp-gspL grown in RM and PM with anti-GFP antibodies. Total proteins contained in cellular extracts used in (C) were detected by SDS-PAGE electrophoresis and silver nitrate staining as loading control for immunoblot.
