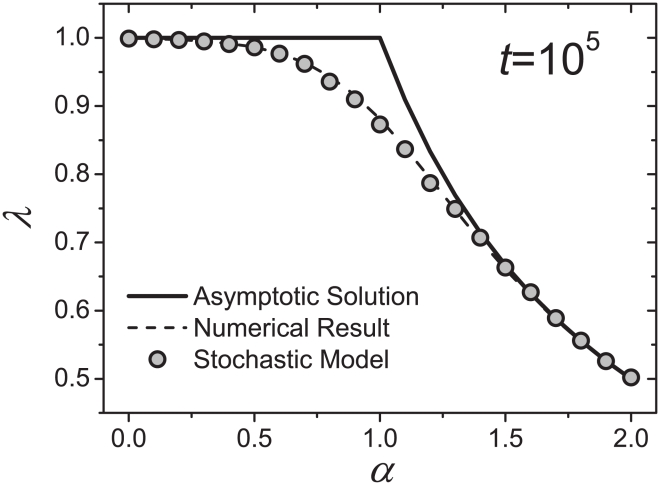
Figure 1. Relationship between the Heaps' exponent  and Zipf's exponent
  .
.
The solid curve represents the asymptotic solution shown in Eq. 7, the dash curve is the numerical result based on Eq. 6, and the circles denote the result from the stochastic model. For the numerical result and the result of the stochastic model, the total number of word occurrences is fixed as  . The Heaps' exponents
  for the numerical results of Eq. 6 and the simulation results of the stochastic model are obtained by using the least square method.

