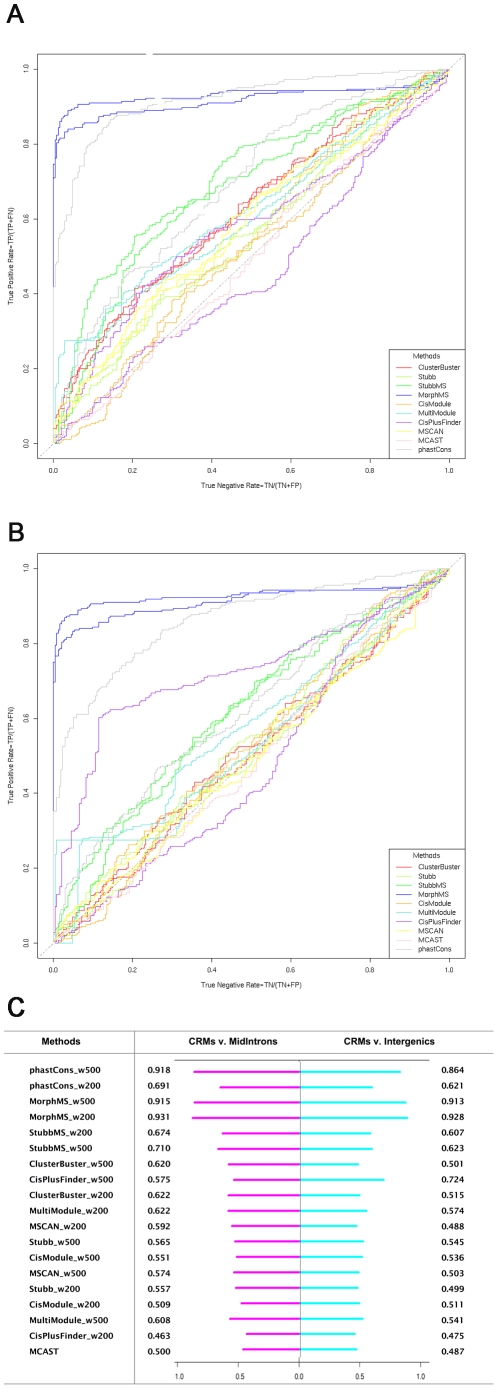
Figure 5. Ranking of methods (medium length introns and intergenic regions).
A. Predictions of CRMs against medium length introns. There are two ROC curves for each method, one for 500 bp and one for 200 bp window size. B. Predictions of CRMs against intergenic regions. There are two ROC curves for each method, one for 500 bp and one for 200 bp window size. C. The Area Under Curve scores of the assessed methods.

