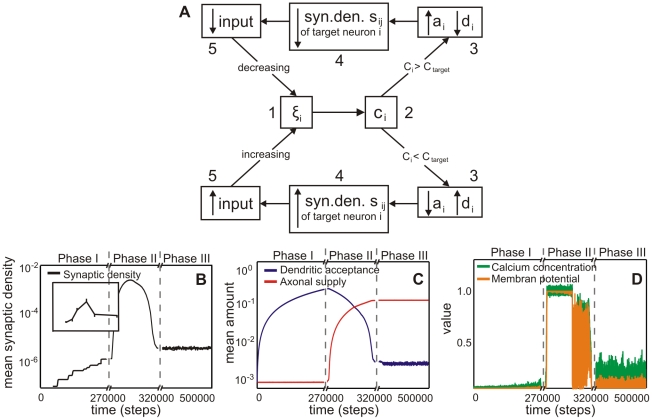
Figure 4. The development of the model shows three different phases (Phase I, II and III).
(A) Box diagram of the model feedback loop. Variables are membrane potential  , calcium concentration
  , axonal supply
  and dendritic acceptance
  , and connectivity
  between dendrite
  and axon
  and the constant homeostatic value
  . The up and down arrows indicate if a variable is increased/decreased. For details see main text. (B) The mean synaptic density
  develops comparable to experimental findings in cell cultures (see inset from [24]). Note, time axis has been stretched in the middle. (C) Development of the average axonal supplies and dendritic acceptances. The network model passes through three different developmental phases: the first phase is characterized by a pronounced increase of the dendritic acceptance. During development, the network undergoes a transition (second phase) and finally it reaches a homeostatic equilibrium (third phase) with more axonal supplies than dendritic acceptances. (D) Network activity and calcium concentration change accordingly. At the beginning, activity rises slowly until a transition happens. During the transition, activity reaches its maximum and subsequently decreases to a homeostatic value.

