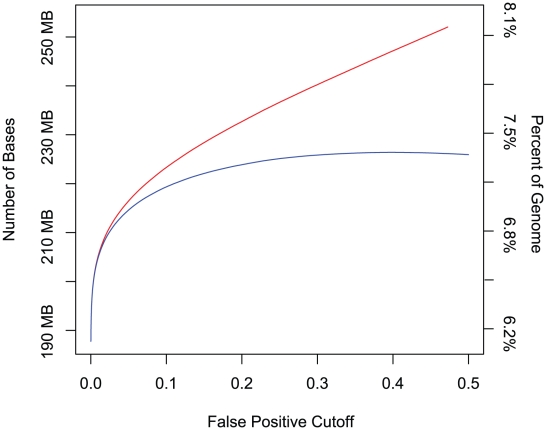
Figure 3. Estimating detectable constraint.
The red curve represents the number of bases within predicted constrained element as a function of the false positive cutoff parameter. The blue curve represents the number of predicted bases minus the expected number of false positive bases, also as a function of the false positive cutoff.

