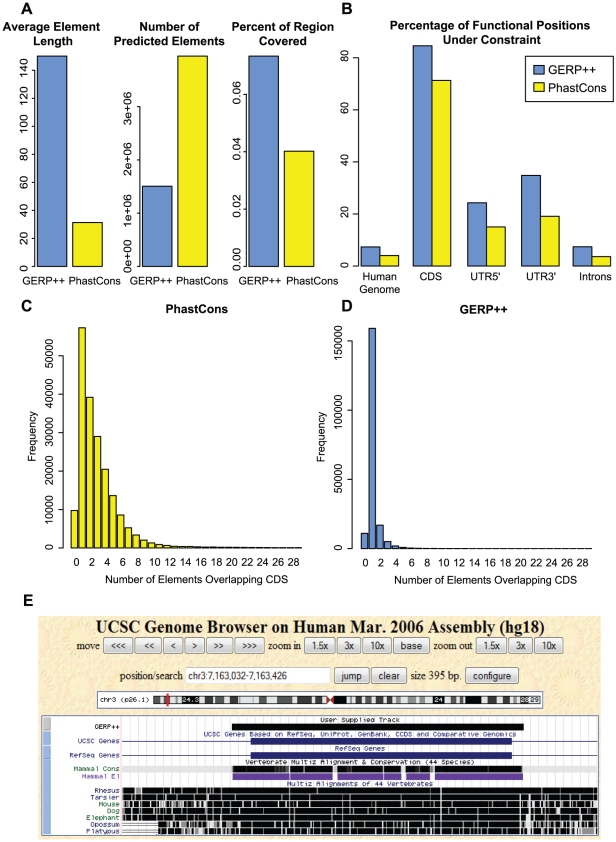
Figure 6. GERP++ vs phastCons predictions.
(A) Mean length (left), number (middle) and total length (right) of constrained elements predicted by GERP++ (blue) and phastCons(yellow). (B) Nucleotide-level fraction of annotated exons, introns, UTRs and noncoding RNAs genes covered by GERP++ (blue) and phastCons (yellow) predictions. (C&D) Histogram of number of distinct predicted GERP++ (blue, D) and phastCons(yellow, C) constrained elements overlapping each annotated coding exon. Note the difference in scale on the y-axis. (E) A constrained region slightly over 200 base pairs in length that contains a known exon, as annotated by GERP++ (labeled ‘GERP++’, black) and phastCons (purple track labeled ‘Mammal El’). Note how phastCons fragments the exon into multiple CE predictions.

