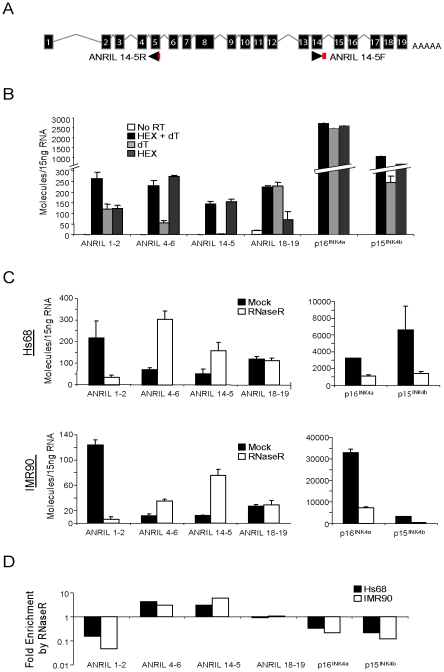
Figure 3. ANRIL 14-5 and 4-6 are circular RNAs.
A, Schematic representation of the ANRIL14-5 Taqman detection strategy wherein the probe (red) spans the exon 5-exon 14 boundary amplified with outward facing primers. B, Expression of the indicated transcripts was quantified in cDNA from Hs68 cells made using the indicate primers (-RT: no reverse transcriptase, H+dT: an equal mix of random hexamers and oligo dT, dT: oligo dT alone, and HEX: random hexamers alone). Error bars represent the standard deviation for three replicates. C, Total RNA harvested from growing Hs68 (top) and IMR90 (bottom) cells was incubated with our without RNase R, purified and reverse transcribed. The indicated transcripts were quantified in ‘B’. D, The average fold enrichment by RNase R for each transcript is shown on a log10 scale.

