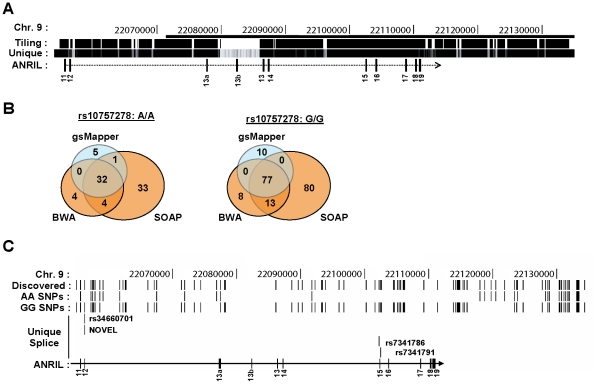
Figure 6. Deep sequencing of 9p21 in pools of rs10757278 homozygotes.
A, The region captured using DNA sequence capture technology is shown on the ‘Tiling’ track. The ‘Unique’ track shows the Duke 35 bp Uniqueness information as provided in the UCSC Genome Browser. The bar at the top of the figure represents the 53 kb risk interval previously defined by Broadbent et al. [13]. B, Venn diagrams depicting SNP calls for the AA (left) and GG (right) samples using three different algorithms. C, Using the UCSC Genome Browser, SNPs identified by next-generation DNA sequencing are depicted across the captured region of 9p21. The ‘Discovered’ track shows the polymophisms identified by two or more algorithms in either the pooled AA or GG sample. SNPs unique to each genotype are shown below. The ‘Unique Splice’ track depicts the location of the 4 SNPs, unique to the GG sample, which modify cis-acting splice regulation sites (See also Table S1).

