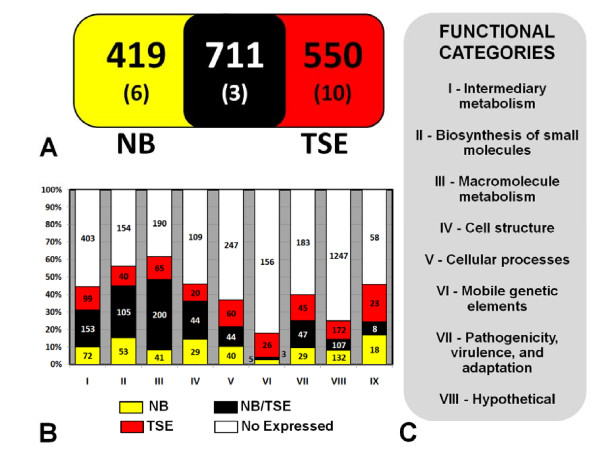
Figure 2.
Proteomic analysis of Xanthomonas citri subsp. citri under non-infecting conditions. (A) A comparison of identified proteins from Xac grown on NB culture medium and Xac grown on TSE culture medium (* denotes plasmid's protein). (B) Comparison of the Xac proteins identified in this study and the genomic prediction per categories (C). For clarity, proteins with undefined functions are excluded from the chart. The red color represents Xac proteome in TSE, yellow color represents Xac proteome in NB, black represents protein detected in both media and white refers to proteins not detected.

