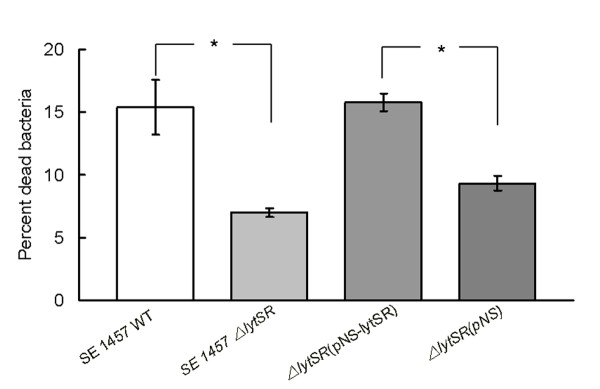
Figure 9.
Quantitative analysis of bacteria cell death in 24-hour-old biofilms. Live/dead stained biofilm cells were scraped from the dish and dispersed by pipetting. The integrated intensities of the green (535 nm) and red (625 nm) emission of suspensions excited at 485 nm were measured and the green/red fluorescence ratios (RatioR/G) were calculated. The percentage of dead cells inside biofilm was determined by comparison to the standard curve of RatioR/G versus percentage of dead cells. Data are means ± SEM of 3 independent experiments. *P < 0.05; ΔlytSR vs. WT; ΔlytSR(pNS-lytSR) vs. ΔlytSR(pNS-lytSR).

