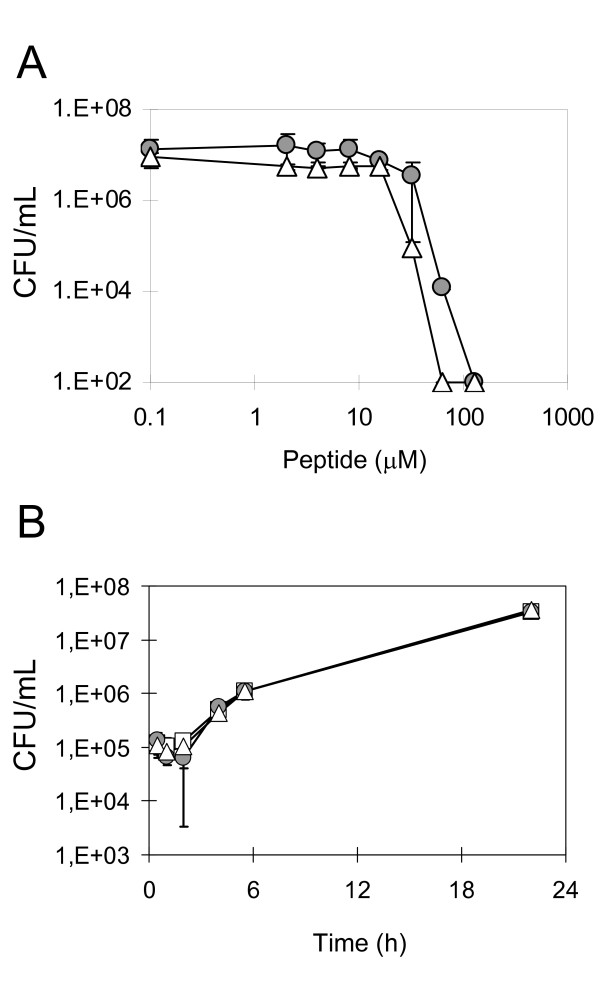
Figure 1.
Antifungal activity of peptides PAF26 and melittin to S. cerevisiae FY1679. (A) Dose response curve of cell killing activity. Cells were exposed to different concentrations of peptides for 24 h. Cell survival (measured as CFU/mL) was determined by dilution and plating. (B) Time course of cell population growth was followed in the presence of 5 μM of peptide. No significant differences were found between each of the peptides and the control treatment. In both (A) and (B) panels, grey circles and white triangles indicate PAF26 and melittin samples, respectively; in (B), white squares show controls in the absence of peptide.

