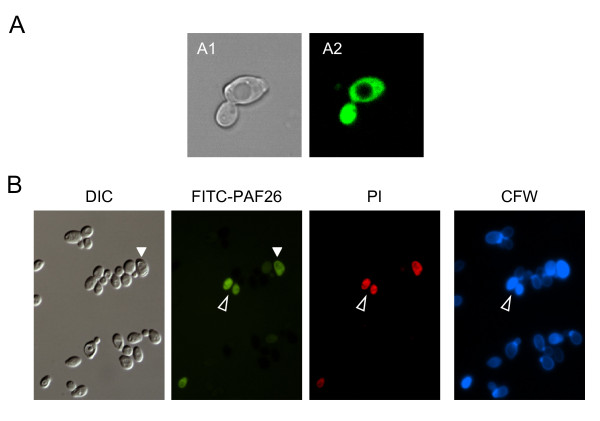
Figure 6.
Fluorescence microscopy of S. cerevisiae exposed to FITC-PAF26. (A) Internalization of FITC-PAF26 into S. cerevisiae FY1679 demonstrated by confocal fluorescence microscopy. Cells were exposed to 30 μM FITC-PAF26 for 30 min. Bright-field (A1) and fluorescence (A2) micrographs of the same field are shown. (B) Interaction of FITC-PAF26 with S. cerevisiae BY4741 visualized by fluorescence microscopy: DIC bright field image, as well as FITC, propidium iodide (PI), and calcofluor white (CFW) signals of the same field are shown. Cells were incubated with 30 μM FITC-PAF26 at 30°C for 2 h, and then at 20°C with 2 μM PI and 25 μM CFW for 5 min. Open arrowheads indicate peptide internalization (compare location of the CW outer signal of CFW with the internal signal of PI and the FITC fluorescence resulting from FITC-PAF26). Solid arrowhead indicates the lower FITC signal in the vacuole compared to the cytosol.

