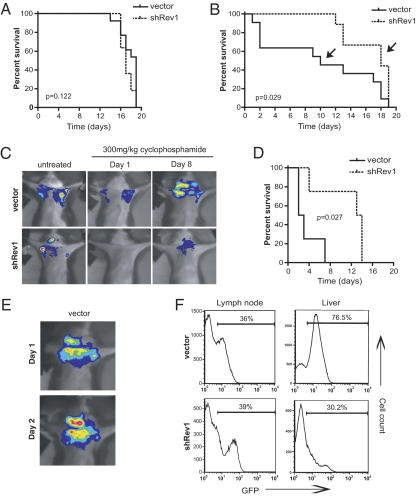
Fig. 4.
Rev1 depletion improves CTX-based chemotherapy in vivo. (A) Kaplan–Meier survival curves of tumor-bearing mice treated with a single dose of CTX (300 mg/kg; n = 13 vector control, n = 11 shRev1). Day 0 represents the day of drug administration. At disease relapse, individual tumors were harvested and reinjected into new recipient mice for additional drug treatment. (B) Kaplan–Meier survival curves of control and shRev1 transplant-bearing mice challenged with a second round of CTX chemotherapy (n = 11 vector control, n = 9 shRev1). As in A, tumors were harvested at relapse and reinjected into naive recipient mice. (C) In vivo GFP imaging showing representative mice from each experimental group (indicated with arrows in B). (D) Round 3 Kaplan–Meier survival data (n = 4 vector control, n = 4 shRev1). P values for all survival studies were determined using log-rank curve comparison tests. (E) GFP imaging of a highly drug-resistant vector control tumor treated with CTX. (F) GFP histograms of dissociated whole tissue harvested from tumor-bearing mice. The percentages represent the proportion of control vector or shRev1 lymphoma cells present in the indicated tissue.

