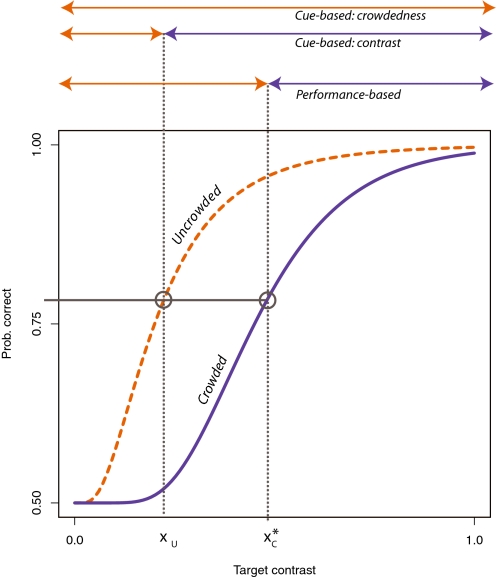
Fig. 3.
Principle of the experiment. The red and blue curves describe hypothetical psychometric functions: They give an observer's expected performance as a function of contrast in the crowded and uncrowded conditions, as in Fig. 2. Suppose we always give the choice between a fixed, uncrowded stimulus with contrast xU and another, crowded stimulus with contrast xC. How can we set xC to make the observer feel more confident about the crowded stimulus? According to the cue-monitoring hypothesis, two cues to uncertainty are available: contrast and crowdedness. If the observer picks crowdedness as a cue, then he or she will always prefer the uncrowded stimulus, no matter what the value of xC. If the observer uses contrast as a cue, then he or she should prefer the crowded stimulus as soon as  . Alternatively, if confidence follows performance, what the observer should do is choose the crowded stimulus as soon as it yields a higher expected performance: here, any point beyond
  . As shown above the plot, for any
  , the predictions of the performance-based hypothesis differ from those of either of the two cue-based models.

