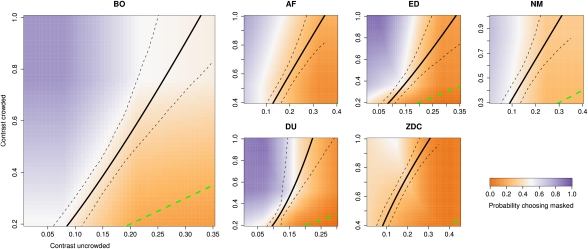
Fig. 4.
Individual results for the uncrowded vs. crowded condition in experiment 1. The observer had to choose between two stimuli, one crowded and the other uncrowded, with target contrasts xC and xU. We plot the probability of choosing the crowded stimulus as a response surface. The solid black contours are contours of the expected performance ratio:  means that the observer had equal probability of making a correct orientation judgment by picking either stimulus. The expected performance ratio is computed from the results of an independent baseline condition (Fig. 2) and shown along with 10–90% bootstrap quantiles (dashed lines) (SI Materials and Methods). The green dashed line is the line
  : Note that the contrast levels for crowded stimuli were on average higher, because the case
  is relatively uninteresting in the context of this experiment (all theories predict that the observer should choose the uncrowded stimulus). NM performed under different feedback conditions than the other five observers (Materials and Methods).

