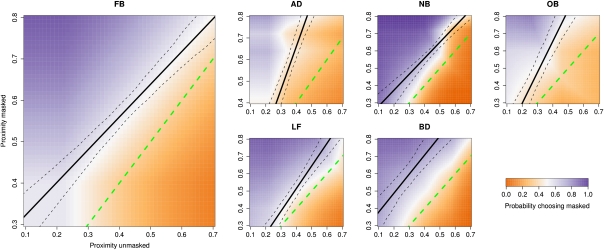
Fig. 7.
Results for the mixed condition in experiment 2. The same general format as in Fig. 4 is followed. The proximity of a stimulus is defined as the opposite of eccentricity. Stimuli with proximity 1 stand next to the fixation cross, and stimuli with proximity 0 are as far from the fixation cross as possible on the monitor used (corresponding to 17.9° of eccentricity). Eccentricity plays the same role here as contrast does in experiment 1. Observers chose between masked and unmasked stimuli, and we plot the probability of choosing the masked one. Again, we would expect that if observers followed the strategy of always picking the stimulus with lower eccentricity, the green dashed line should separate the blue and red regions. The black line represents the line of equal expected performance, with bootstrap 10% and 90% quantiles shown as dashed lines.

