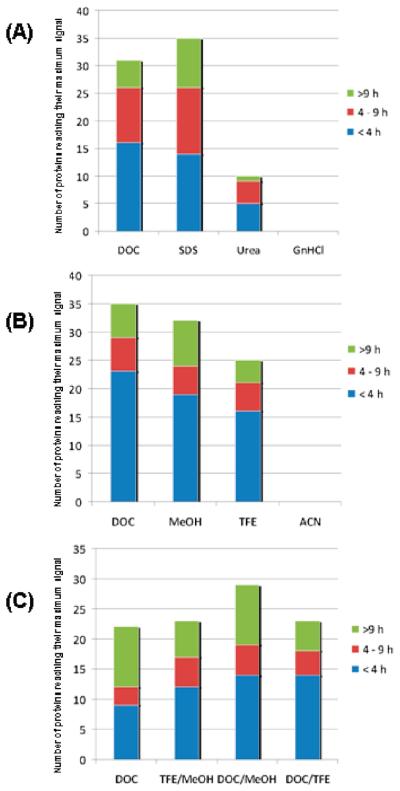
Figure 3.
Ranking of (A) chemical, (B) solvent, and (C) combined denaturant protocols based on the number of proteins (i.e., proteotypic peptides) reaching maximum signal using each digestion protocol. The maximum signal is considered to be the highest peak area ratio for a single analyte that was obtained during the experiment, under any of the experimental conditions used. In each part the maximum average peak area ratio was determined for each of the 45 analytes and sorted by time and the four conditions. For example in part A, none of the 45 analytes achieved maximum signal using GnHCl at any time during digestion when compared to SDS, urea, and DOC.

