
Figure 4.
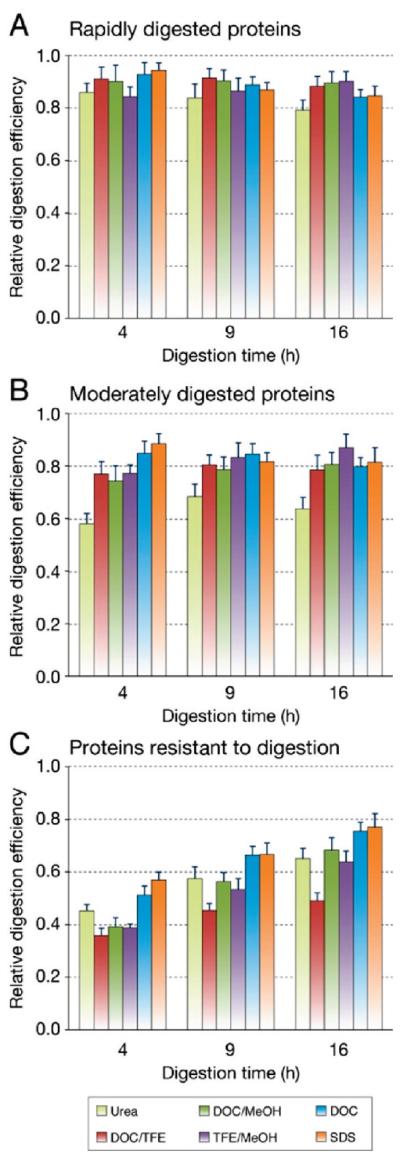
Protein classification by range of digestion efficiency. Proteins were classified into three equal groups based on the range of digestion efficiency observed between methods and digestion times: proteins that were rapidly digested to equivalent levels regardless of the denaturation methods (A), proteins with an intermediate range of digestion efficiencies (B), and proteins either slowly or poorly digested with at least one protocol (C). Error bars represent the average standard deviation of normalized peak area ratios measured in 5 replicate digests.