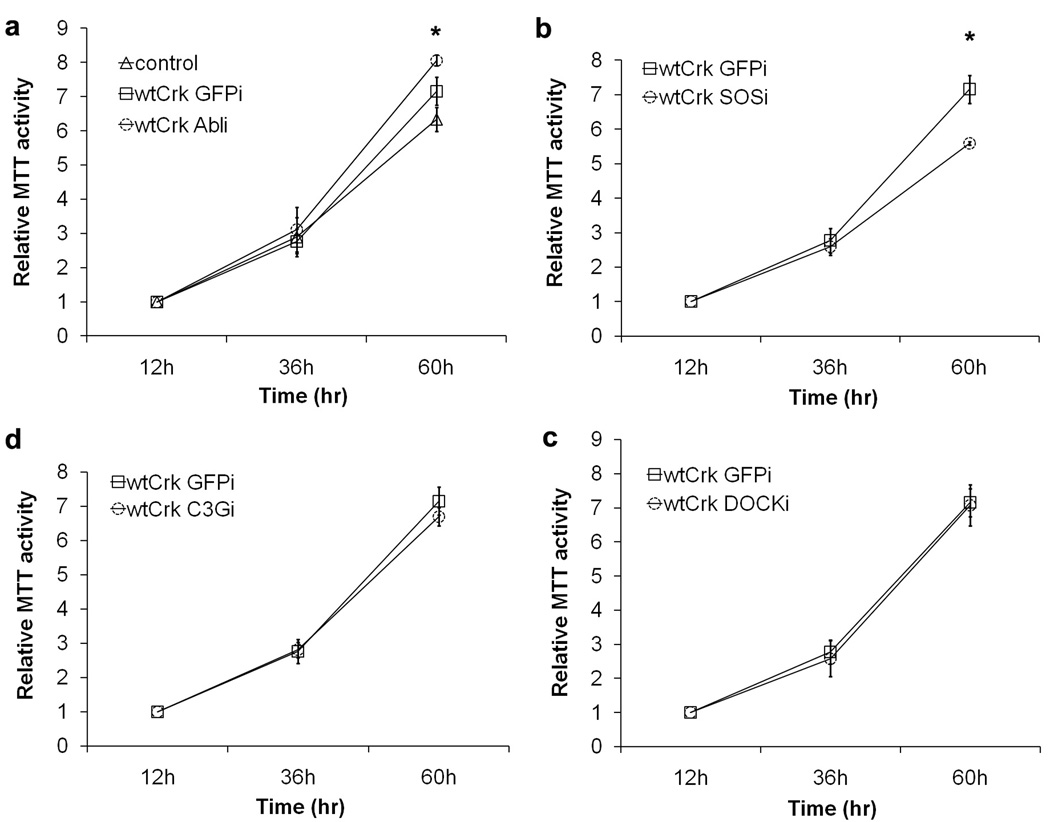
Fig. 4.
In vitro proliferation. Knockdown cell lines expressing CrkI were prepared as in Fig. 2, and plated in 96 well plates. Normal NIH-3T3 cells were used as negative control. Cell growth in complete medium was determined via MTT assay over time (hrs). Average relative MTT activity ± standard deviation is shown. *P < 0.05 between wtCrk-GFPi and wtCrk-Abli or wtCrk-SOSi cell lines at 60 h using ANOVA test. No significant difference was found between wtCrk-GFPi and wtCrk-C3Gi or wtCrk-DOCKi cell lines.

