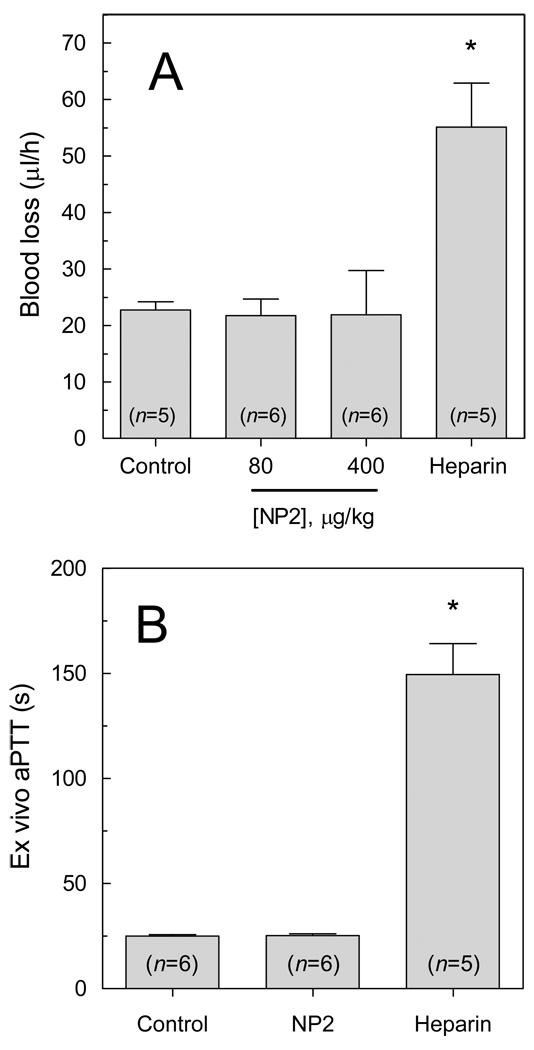
Figure 6. Hemostatic parameters are not changed by NP2.
(A) Bleeding effect by transection model. PBS (control), NP2 (80 or 400 µg/kg) or heparin (1 mg/kg) was administered i.v. and allowed to circulate for 15 min. Blood loss was determined as a function of hemoglobin in water (A540 nm), as described in the material and methods section. Data are reported as mean ± SE. Asterisk, P < 0.01, as compared to values observed in control group. (B) Ex vivo aPTT. PBS (control), NP2 (400 µg/kg) or heparin (1 mg/kg) was administered i.v. and allowed to circulate for 30 min. Blood collection, plasma preparation and aPTT measurement were performed as described in the Material and methods section.

