
Fig. 1.
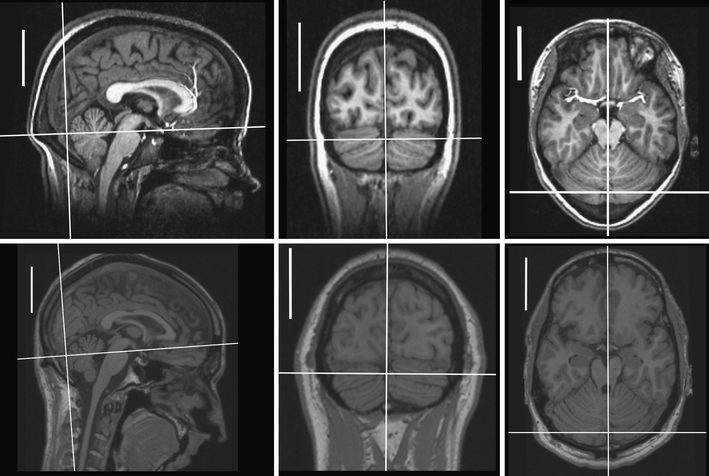
Site of rTMS stimulation. MRIs of two of the subjects in the study showing the site stimulated; the white crosshairs represent the intended target of stimulation. Note the position of the visual cortex in relation to the inion. There is a 5-cm white scale bar to the left side of each image