
Figure 6.
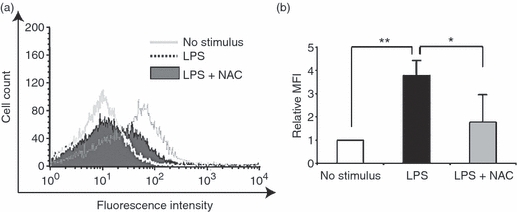
Antioxidative treatment suppresses tissue factor (TF) expression in lipopolysaccharide (LPS) -stimulated human umbilical vein endothelial cells (HUVECs). (a) Representative data of TF expression assessed by flow cytometry. Note that LPS-induced TF expression was suppressed by the treatment with an antioxidant, N-acetylcysteine. (b) Quantitative analysis of TF expression in LPS-stimulated HUVECs with antioxidant treatment. The relative mean fluorescence intensity (MFI) is shown on the y-axis. The data represent mean values ± SD (n = 4, **P < 0·01, *P < 0·05, Student's t-test).