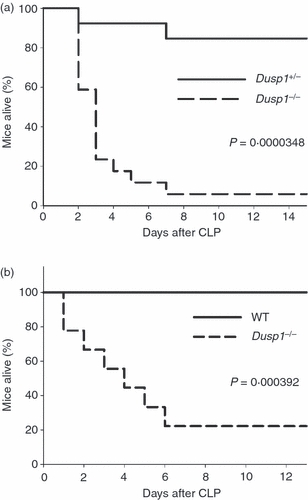
Figure 5.

Increased lethality of Dusp1−/− mice after caecal ligation and puncture (CLP). Kaplan–Meier survival curves of mice after CLP. (a) Mixed 129 × C57BL/6 background, heterozygous littermate controls; data are pooled from two experiments (n = 17 for Dusp1−/−, n = 13 for Dusp1−/−). (b) C57BL/6 background, wild-type (WT) controls from Harlan. Pooled from two experiments (n = 10 for both genotypes. Statistical testing was done using the log rank test.
