
Figure 1.
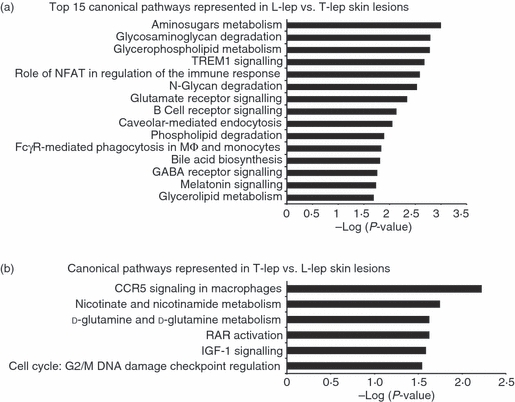
Enriched canonical pathways in the spectrum of leprosy. The canonical pathways analysis was generated through the use of Ingenuity Pathways Analysis (http://www.ingenuity.com). (a) The top 15 canonical pathways in lepromatous leprosy (L-lep) versus tuberculoid leprosy (T-lep) are ranked by their P-values (x-axis). (b) All canonical pathways in T-lep versus L-lep are ranked by their P-values (x-axis). Fischer's exact test was used to calculate a P-value determining the probability that each pathway represented by the expression data was due to chance alone.