
Figure 4.
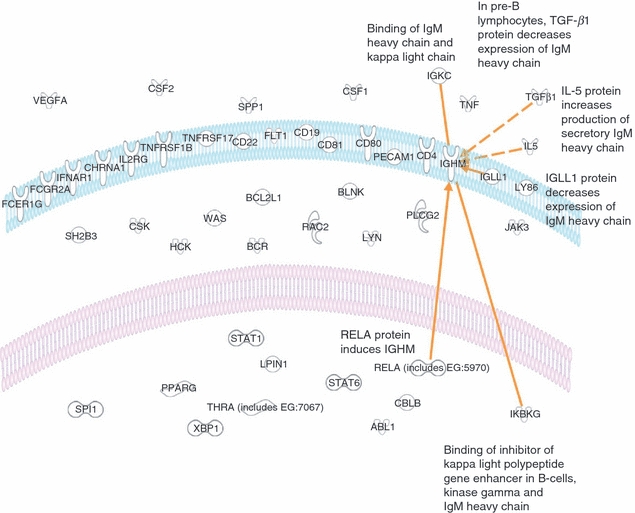
Diagram illustrating the cellular location and relationships. Each of the genes identified by analysis of functional groups involving B cells is shown. Further analysis of relationships between all B-cell genes and IGHM revealed six relationships (orange lines or arrows) requiring no additional nodes.