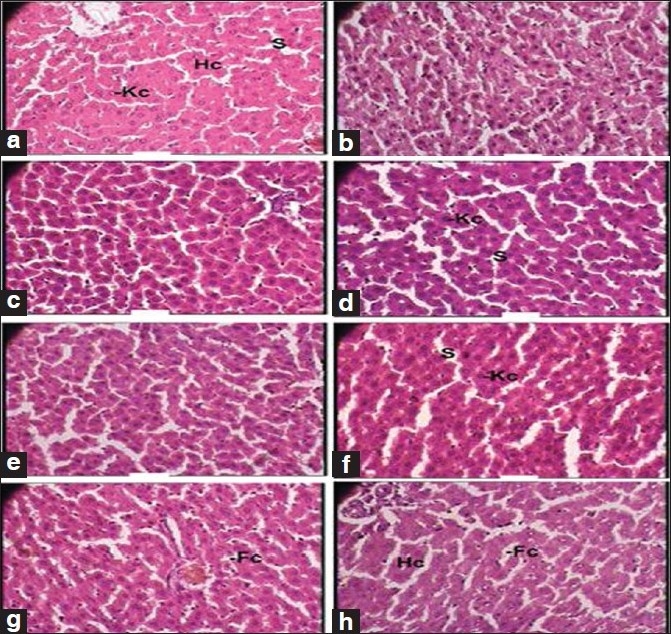
Figure 2.

Photomicrographs of sections of the liver. Note the normal cytoarchitecture, (a, b): Control group (1 × 400 magnification). Hc, hepatic cell; Kc, Kupffer cell; S, sinusoid, (c, d): Therapeutically equivalent dose group (1 × 400 magnification). Kc, Kupffer cell; S, sinusoid, (e, f): Therapeutically equivalent dose × 5 group (1 × 400 magnification). Kc, Kupffer cell; S, sinusoid, (g, h): Therapeutically equivalent dose × 10 group (1 × 400 magnification). Hc, hepatic cell
