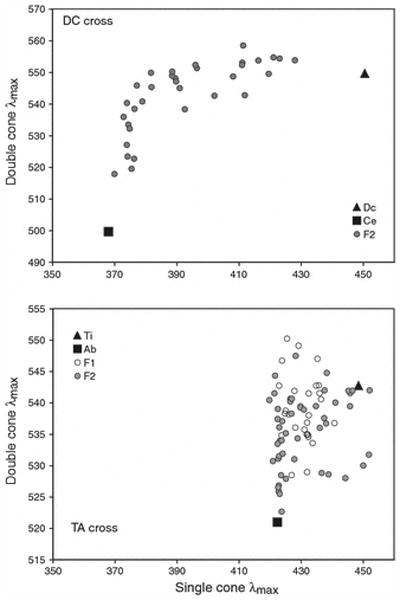
Figure 2.

A plot of the average single versus average double cone wavelengths for the DC and TA crosses including parentals and F2. For the TA cross, F1 are also shown. Average wavelengths are calculated based on individual gene expression using equations 3a and 3b.
