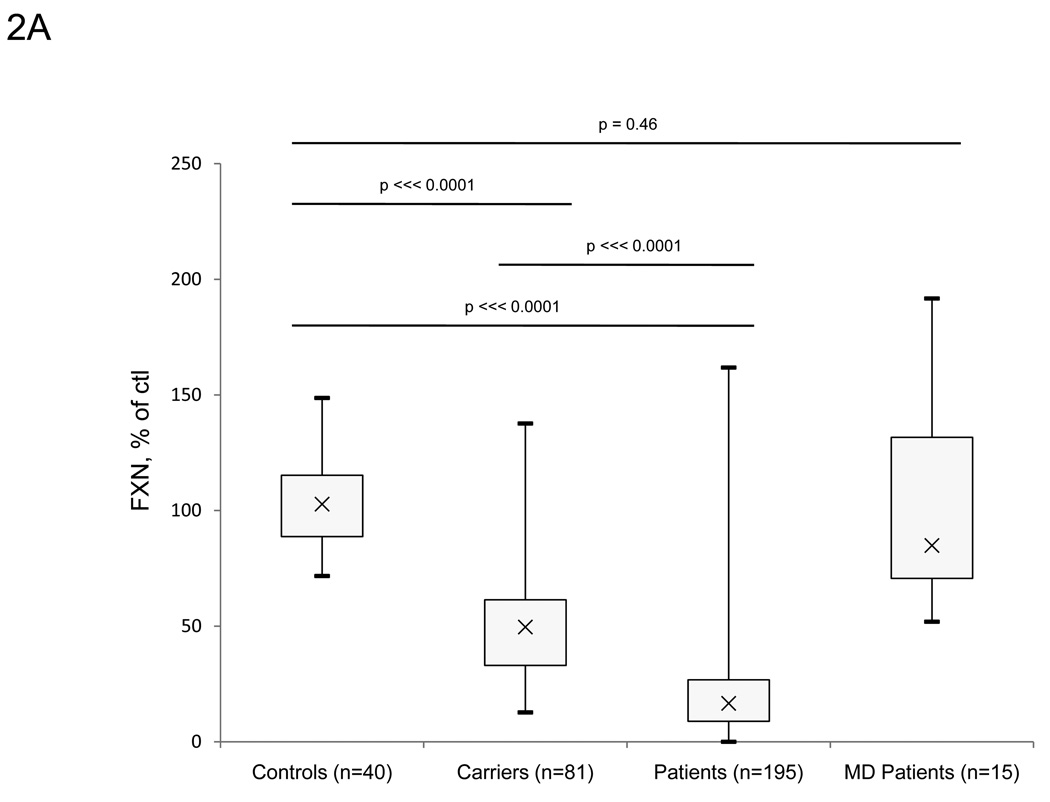
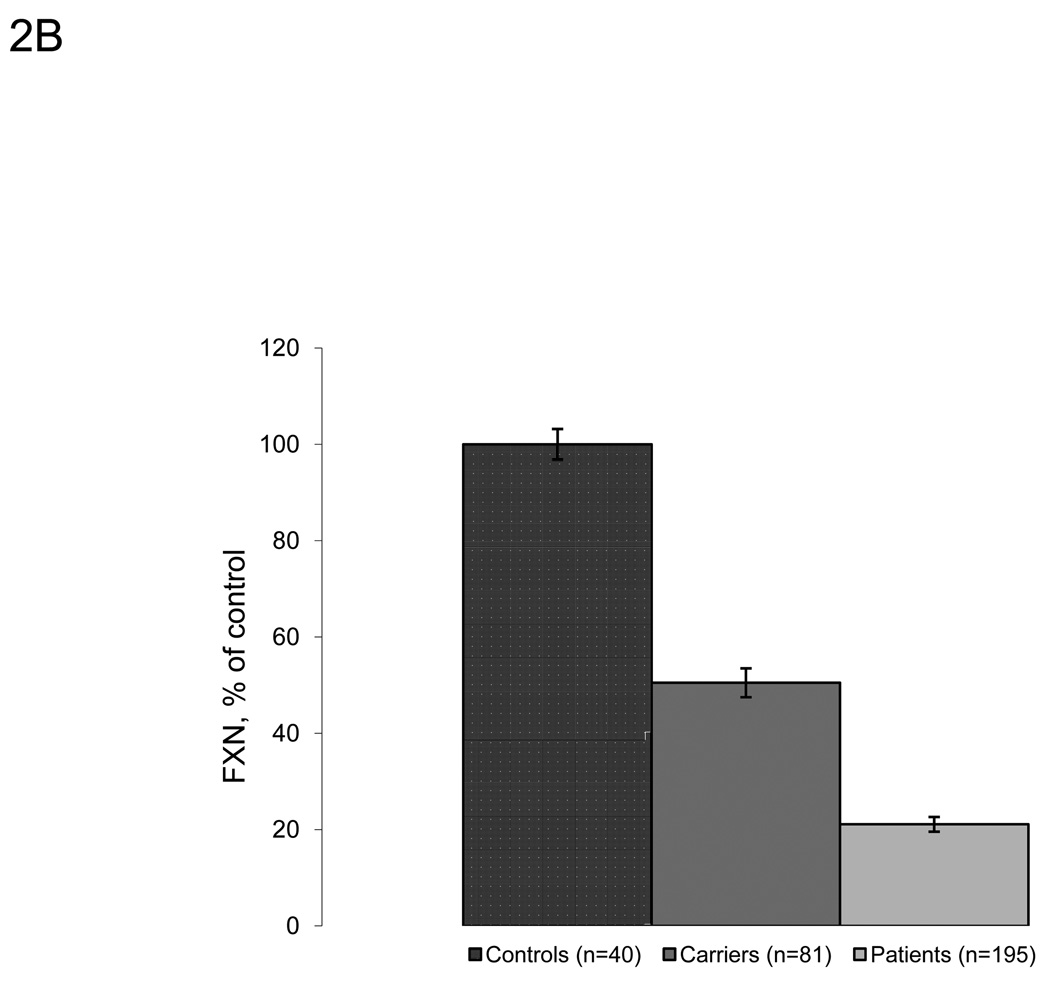
Figure 2.
Lateral flow immunoassays showed significant differences between controls, known carriers and patients in collected buccal cell samples. A. Frataxin protein levels in buccal cells collected from controls (n=40), known carriers (n=81), patients (n=195), and non-FA movement disorder (MD) patients (n=15). Buccal cells were collected and assayed as described in the Methods section, and data is expressed as frataxin, % of average control for that day’s experiment. The carrier group contains 3 outliers (>1.5*IQR above/below quartiles), while the patient group contains 9 outliers. The p-values (Student’s t-test) were calculated for two samples assuming equal variance. B. Average frataxin protein levels in buccal samples collected in A. (expressed as % of control). Known carriers (n=81) and patients (n=195) show significant decreases in frataxin protein (50.5% and 21.1% of control, respectively) compared to controls (n=40).


